1. INTRODUCTION
Geohazards such as soil erosion, landslides, and flash floods represent major environmental threats in small mountainous catchments, where steep slopes, weak lithology, sparse vegetation, and intensive rainfall can jointly increase geomorphic instability. Their impacts are further intensified by land-use change, deforestation, unsustainable land management, and climate variability, which create complex spatial patterns of susceptibility and risk (Sassa, 2023; Sousa et al., 2021; Di Salvo et al., 2024). In such environments, remote sensing and Geographic Information Systems (GIS) provide an effective decision-support framework for integrating terrain, geological, hydrological, climatic, and land-cover data into spatially explicit hazard assessments, particularly for identifying critical zones relevant to watershed management and risk reduction (Katapodi & Antoniou, 2025).
GIS-based modelling is widely applied for assessing individual geohazards, including soil erosion, landslide susceptibility, and flash flood potential. Soil erosion is commonly evaluated using empirical and semi-empirical approaches such as USLE/RUSLE and the Erosion Potential Model (EPM) (Gavrilović, 1972; Hanane et al., 2024; Sud et al., 2024). Recent applications in contrasting catchments further show that erosion estimates may vary considerably depending on model structure, parameterization, and the scale at which drainage-basin characteristics are represented (Vujačić et al., 2023; Bytyqi & Agaj, 2024). The EPM has shown reliable applicability in North Macedonia and other mountainous environments, particularly where erosion intensity is controlled by lithology, slope, land cover, and precipitation (Aleksova et al., 2023; Aleksova et al., 2024a; Milevski et al., 2024; Bezak et al., 2024). Landslide susceptibility assessment similarly relies on the spatial relationship between landslide occurrence and conditioning factors such as slope, lithology, land cover, curvature, and distance from drainage networks, while flash flood susceptibility is commonly assessed using terrain, lithological, land-cover, and vegetation-related indicators, including the Flash Flood Potential Index (FFPI) (Smith, 2003; Milevski et al., 2019; Aleksova et al., 2025; Milevski et al., 2025b). Flood-vulnerability assessment is increasingly framed not only as susceptibility mapping, but also as a basis for prioritizing prevention and mitigation measures in locally exposed areas (Dubey et al., 2025).
Although parametric and statistical models are useful for individual hazard assessment, they often treat erosion, landslides, and flash floods separately, despite the fact that these processes may occur within the same geomorphic system. This is particularly important in small fan-shaped and torrential catchments, where sediment production, slope instability, and rapid runoff may spatially overlap. Multi-Criteria Decision-Making methods, especially the Fuzzy Analytic Hierarchy Process (FAHP), provide a complementary approach by integrating expert-based judgement with fuzzy logic and reducing uncertainty in the weighting of hazard-conditioning factors. FAHP has therefore been increasingly applied in recent studies of landslide, flood, and soil erosion susceptibility (Gopinath et al., 2024; Mokarram et al., 2024; Çıkmaz et al., 2025). Hybrid expert-based and machine-learning approaches represent a promising direction in flood-susceptibility assessment (Gorsevski & Milevski, 2026).
Despite these methodological advances, integrated multi-hazard assessments remain limited in small ungauged catchments of the Western Balkans, where field data are often scarce and geomorphic processes are spatially concentrated. In such areas, the comparison between established parametric models and FAHP-based susceptibility modelling is important for evaluating how different methodological assumptions influence the delineation of hazard-prone zones. At the same time, spatial overlay of independently modelled hazards can provide a practical first step for identifying zones of concurrent susceptibility, although it should be interpreted as an overlay-based multi-hazard approach rather than a fully dynamic cascading-hazard model (Pourghasemi et al., 2020; UNDRR, 2025).
The Crnička Reka Catchment in eastern North Macedonia represents a suitable case study because of its small size, steep terrain, fan-shaped sections, weak geological formations, sparse vegetation in the lower parts, and active geomorphic processes, including three currently active landslides. Previous studies in the wider area mainly addressed erosion and landslide processes at local or municipal scale (Milevski, 2004; Kenderova & Milevski, 2010; Milevski & Ivanova, 2013; Milevski et al., 2013a), while an integrated comparison of parametric geohazard models and FAHP-based susceptibility assessment has not yet been conducted for this catchment.
Therefore, this study aims to assess multi-hazard susceptibility in the Crnička Reka Catchment by integrating conventional GIS-based models—EPM for soil erosion, LSI for landslide susceptibility, and FFPI for flash flood potential—with FAHP-based multi-criteria modelling. The specific objectives are to: (i) map individual susceptibility to soil erosion, landslides, and flash floods; (ii) compare the spatial outputs of parametric models and FAHP; (iii) identify zones of overlapping susceptibility as multi-hazard hotspots; and (iv) evaluate the implications of these patterns for watershed management, land-use planning, and local risk reduction.
2. MATERIALS AND METHODS
2.1. Overview of the study area (Crnička Reka Catchment)
The Crnička Reka Catchment is located in the Maleševo–Pijanec Basin in eastern North Macedonia and represents one of the most erosion-prone small catchments in the country (Figure 1). It is a short right-bank tributary of the Želevica River, within the Bregalnica River Basin. The river originates on Vlaina Mountain below Kadiica peak at 1598 m a.s.l. and flows into the Želevica River downstream of the village of Crnik at 755 m a.s.l. Although the main channel is only 9.1 km long, it has a pronounced longitudinal gradient of 843 m, or 92.6‰, which strongly favors torrential runoff, sediment transport, and slope instability.
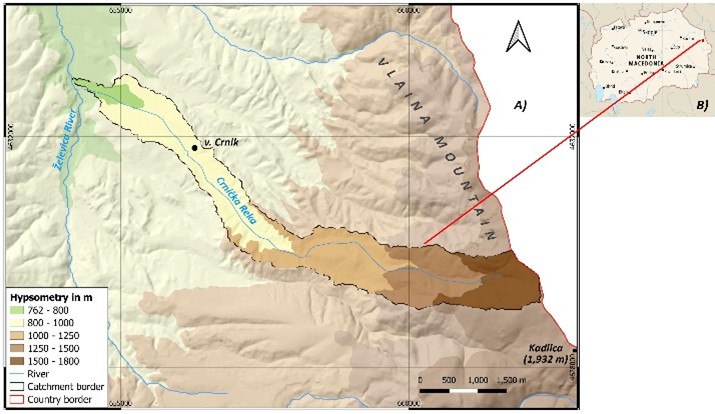
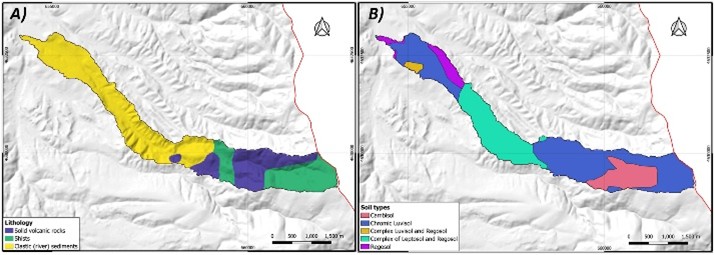
The catchment covers 6.8 km2 and is characterized by an elongated morphology controlled by geological structure and tectonically influenced valley development. Elevation ranges from 762.8 to 1800.6 m a.s.l., with an average elevation of 1151.1 m. The upper part of the catchment is developed mainly in Cambrian and Jurassic volcanic rocks, including diabase and gabbro, together with Cambrian schists, whereas the lower section is incised into Pliocene lacustrine-swamp sediments. These lithological contrasts are important because the lower valley, developed in loose clastic sediments, is particularly susceptible to erosion, landslides, and torrential processes (Kovačević & Rakičević, 1973).
Soil conditions further contribute to the spatial variability of geohazard susceptibility. Chromic Luvisols occur in the upstream and downstream sections, while the central and lower parts include complexes of Leptosol and Regosol, Regosols, and Luvisol–Regosol associations (Figure 2; Table 1). These soil units are relevant for erosion and runoff generation because shallow and weakly developed soils, particularly Leptosols and Regosols, have reduced stability and limited resistance to intense rainfall and surface runoff.
|
Table 1. Lithological units and soil distribution of the catchment. |
||
|
Lithology |
Area (km2) |
Area (%) |
|
Solid volcanic rocks |
1.60 |
23.48 |
|
Shists |
1.63 |
24.02 |
|
Clastic sediments |
3.57 |
52.49 |
|
Total |
6.80 |
100.00 |
|
Soil types |
Area (km2) |
Area (%) |
|
Chromic Luvisol |
2.24 |
32.88 |
|
Complex of Leptosol and Regosol |
1.49 |
21.92 |
|
Cambisol |
1.21 |
17.81 |
|
Regosol |
1.02 |
15.07 |
|
Complex of Luvisol and Regosol |
0.84 |
12.33 |
|
Total |
6.80 |
100.00 |
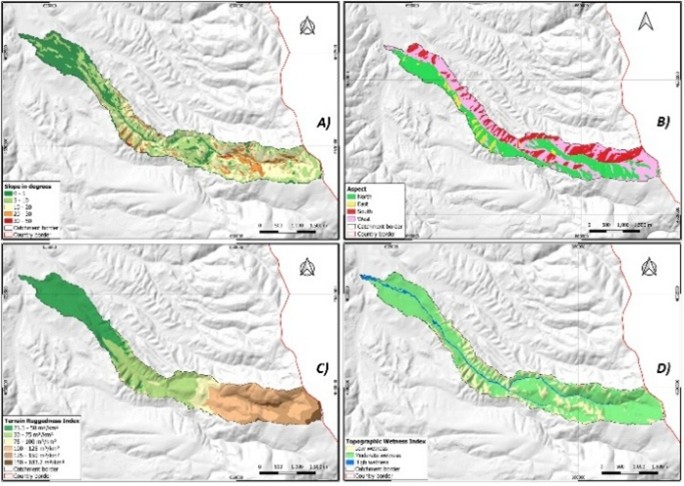
Morphometrically, the catchment is steep and dissected. The average slope is 17.7°, while the 20 - 30° slope class dominates 36.5% of the total area. Slopes above 30° cover almost 40% of the basin, indicating high potential for mass movement and accelerated erosion (Figure 3; Table 2). Northern aspects prevail due to the elongated catchment shape and the orientation of the Vlaina Mountain slopes. Terrain Wetness Index values indicate generally limited moisture accumulation, although wetter zones are locally concentrated along drainage lines and concave terrain positions, where runoff concentration and slope instability may increase.
|
Table 2. Morphometric characteristics of the catchment. |
||
|
Slopes in degrees |
||
|
Class |
Area (km2) |
Area (%) |
|
0-10 |
0.5 |
7.2 |
|
10-20 |
1.1 |
16.8 |
|
20-30 |
2.5 |
36.5 |
|
30-40 |
2.0 |
29.5 |
|
>40 |
0.7 |
10.0 |
|
Total |
6.8 |
100.0 |
|
Aspect |
||
|
Side |
Area (km2) |
Area (%) |
|
North |
3.9 |
57.9 |
|
East |
1.3 |
18.6 |
|
South |
0.3 |
4.2 |
|
West |
1.3 |
19.3 |
|
Total |
6.8 |
100.0 |
|
TRI in m3/km2 |
||
|
Class |
Area (km2) |
Area (%) |
|
21.3-50 |
1.8 |
27.1 |
|
50-75 |
1.8 |
25.9 |
|
75-100 |
1.6 |
23.4 |
|
100-125 |
1.0 |
14.1 |
|
125-150 |
0.5 |
6.9 |
|
150-183.2 |
0.2 |
2.4 |
|
Total |
6.8 |
100.0 |
|
TWI |
||
|
Class |
Area (km2) |
Area (%) |
|
Low wetness |
4.9 |
71.8 |
|
Moderate wetness |
1.6 |
23.0 |
|
High wetness |
0.4 |
5.2 |
|
Total |
6.8 |
100.0 |
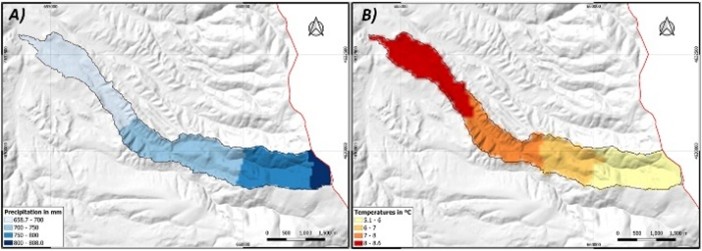
Precipitation is one of the main controlling factors of recent erosion and torrential activity in the catchment. ERA5 data for 2007 - 2018 indicate annual precipitation between 658.7 and 808.0 mm, with an average of 725.2 mm, while higher parts of Vlaina Mountain receive larger amounts (Figure 4). Torrential rainfall, mainly in autumn and occasionally during summer, promotes the development of rills, gullies, badlands, earth pyramids, and landslides, especially after prolonged dry periods (Milevski & Ivanova, 2016; Copernicus Climate Change Service, 2019). Mean annual air temperature ranges from about 10.5 °C in the lower areas to 4 - 5 °C at the highest elevations.
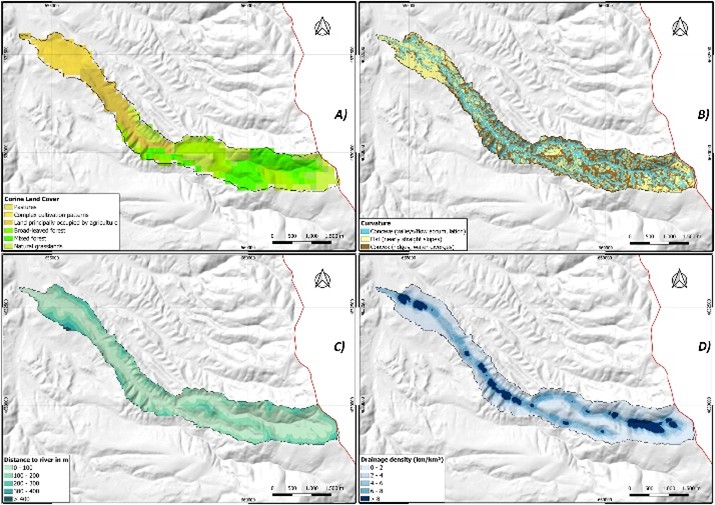
Vegetation and land-cover conditions strongly influence erosion and flash-flood susceptibility. According to CORINE Land Cover (2018), the catchment includes broad-leaved forest, mixed forest, pastures, complex cultivation patterns, transitional woodland-shrub, and natural grasslands (Figure 5; Table 3). Sparse vegetation and bare or weakly lower valley, where loose sediments and protected surfaces are particularly widespread in the anthropogenic pressure increase the erosive effect of rainfall. Numerous active erosional forms, including rills, gullies, badlands, earth pyramids, and landslides, have been documented in this area, with clear differences in erosion intensity between the upper and lower parts of the catchment (Milevski, 2008; Milevski & Ivanova, 2013; Milevski et al., 2013b).
|
Table 3. Corine Land Cover (CLC2018) classes. |
||
|
CLC2018 classes |
Area (km2) |
Area (%) |
|
Pastures |
1.19 |
17.54 |
|
Complex cultivation patterns |
1.07 |
15.79 |
|
Land principally occupied by agriculture, with significant areas of natural vegetation |
0.48 |
7.02 |
|
Broad-leaved forest |
1.43 |
21.05 |
|
Mixed forest |
1.19 |
17.54 |
|
Natural grasslands |
0.36 |
5.26 |
|
Transitional woodland-shrub |
1.07 |
15.79 |
|
Total |
6.80 |
100.00 |
For the susceptibility analysis, the main spatial conditioning factors derived for the catchment include lithology, soil type, slope, aspect, curvature, Terrain Ruggedness Index, Terrain Wetness Index, precipitation, temperature, land cover, distance to river, and drainage density. These variables were used as input parameters for the EPM, LSI, FFPI, and FAHP models. Detailed class distributions of lithology, soil types, morphometric parameters, and land-cover categories are provided in Tables 1 - 3.
2.2. Soil Erosion assessment (Erosion Potential Method)
Soil erosion in the Crnička Reka Catchment was assessed using the Erosion Potential Method (EPM), also known as the Gavrilović method (Gavrilović, 1972). The model was implemented in a GIS environment using a 5 m Digital Elevation Model from the State Agency for Real Estate Cadastre of North Macedonia, geological maps, soil maps, CORINE land-cover data, Sentinel-2 imagery, and ERA5 climate data. The EPM estimates mean annual sediment production using the following equation:

where, Wy is mean annual sediment production, T is the temperature coefficient, H is annual precipitation, Z is the erosion coefficient, and F is the catchment area. The erosion coefficient Z integrates rock resistance, land-cover conditions, visible erosion processes, and slope:

where, Y represents rock and soil resistance, Xa is the land-cover coefficient, φ represents visible erosion processes, and J is the mean terrain slope.
Geological maps at 1:25,000 scale (Kovačević & Rakičević 1973) and soil maps at 1:50,000 scale (FAO, 2015) were rasterized and resampled to the 5 m DEM resolution. Erodibility values were assigned according to the EPM classification, while the Y coefficient was refined using a square-root transformation following Bezak et al. (2024). Land-cover values (Xa) were derived from CORINE Land Cover data (CORINE Land Cover, 2018), while visible erosion processes (φ) were estimated using the Bare Soil Index (BSI) from Sentinel-2 imagery, following Milevski et al. (2024). Terrain slope (J) was calculated from the DEM.
Climate parameters (T and H) were derived from ERA5 data and validated against observations from the Berovo meteorological station for the period 1991 - 2020, with 97.8% agreement. These parameters were integrated with the erosion coefficient Z to estimate mean annual erosion loss and specific erosion rate. The GIS-EPM approach has previously been validated in North Macedonia and other regions (Bezak et al., 2024; Milevski et al., 2024; Aleksova et al., 2024b), while field investigations were used in this study to support the interpretation of active erosion forms and improve model reliability.
2.3. Landslide susceptibility assessment (Landslide Susceptibility Index)
Landslide susceptibility in the Crnička Reka Catchment was assessed using the Landslide Susceptibility Index (LSI), following the GIS-based framework applied by Milevski et al. (2019, 2024). The analysis considered the main conditioning factors relevant to slope instability in the study area: lithology, slope, plan curvature, land use, and distance from streams and roads. These parameters were selected because they directly influence material strength, slope morphology, runoff concentration, and anthropogenic disturbance, and have been widely used in recent landslide susceptibility studies (Milevski et al., 2019; Beigh & Bukhari, 2024; Li et al., 2024; Zhang & Sun, 2024).
The LSI was calculated by estimating the relative contribution of each parameter class to landslide occurrence. Weighting factors were derived by comparing landslide density within each class with the overall landslide density in the catchment. The weighting factor was calculated as:

where, Wij represents the weight of class i within parameter j, fij is the landslide density for the corresponding class, and f is the overall landslide density in the study area.
In this study, parameter weights were assigned according to their contribution to landslide initiation: slope (30), lithology (15), land use (10), plan curvature (8), distance to streams (2), and distance to roads (2), giving a total weight of 67. Landslide susceptibility was calculated by aggregating the weighted parameter values for each grid cell. The final LSI values were classified into five susceptibility classes, from very low to very high, using the natural breaks method. Field observations and mapped active landslides were used to support the interpretation and validation of the resulting susceptibility zones.
2.4. Flash floods susceptibility assessment (Flash Floods Potential Index)
Flash flood susceptibility in the Crnička Reka Catchment was assessed using the Flash Flood Potential Index (FFPI), implemented in a GIS and remote sensing environment. The FFPI integrates terrain, lithological, land-cover, and vegetation-related parameters and has been widely applied for spatial identification of flash flood-prone areas (Popescu & Bărbulescu, 2023; Shawaqfah et al., 2024; Aleksova et al., 2024c). In this study, lithology was used instead of soil type due to the limited spatial resolution of the available Soil Map of Macedonia at 50k scale (FAO, 2015), while lithological data were derived from the geological map of Kovačević & Rakičević (1973).
The FFPI was calculated using four weighted parameters: slope, lithology, land use, and vegetation cover:

where, M represents terrain slope, S lithology, L land use, and V vegetation cover. Terrain slope was derived from the 5 m DEM and reclassified on a scale from 1 to 10. Lithology was classified into nine categories according to susceptibility to runoff generation and erosion, while land use was obtained from CORINE Land Cover 2018 and ranked from 1 to 10 according to its influence on flash flood susceptibility.
Vegetation cover was represented using the Bare Soil Index (BSI), derived from Sentinel-2 imagery processed in Google Earth Engine (GEE) for the 1999 - 2023 period. The BSI was calculated as:
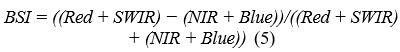
where, Red, SWIR, NIR, and Blue represent the corresponding Sentinel-2 spectral bands. Since BSI values ranged from −1.9 to 0.6, with an average of −0.8, a constant of 1 was added to avoid negative values in the vegetation component. The vegetation parameter was therefore calculated as:

All parameters were standardized and integrated in GIS to produce the final FFPI map. Higher FFPI values indicate areas with steeper slopes, less permeable lithology, sparse vegetation, and land-cover conditions that favor rapid runoff generation and flash flood susceptibility. The resulting susceptibility map was classified into five classes, from very low to very high, using the natural breaks method.
2.5. Multi-hazard parametric-based approach
The multi-hazard assessment was performed by overlaying independently derived susceptibility maps for soil erosion, landslides, and flash floods in a GIS environment. In this study, multi-hazard refers to the spatial co-occurrence of high-susceptibility zones, rather than to dynamic modelling of cascading or time-dependent hazard interactions (Aleksova et al., 2024a,b; Milevski et al., 2024; Di Salvo et al., 2024).
All susceptibility maps were standardized into five classes, from very low to very high, and processed in QGIS v.3.38 and SAGA GIS v.9.7.0. The reclassified raster layers were integrated using the Grid Calculus tool to identify individual hazard zones and areas where two or more hazards overlap. This overlay-based approach provides a practical framework for small data-limited catchments such as Crnička Reka, while its inability to model triggering sequences or temporal hazard dynamics is acknowledged as a limitation.
2.6. Multi-hazard FAHP-based approach
The Fuzzy Analytic Hierarchy Process (FAHP) was applied to account for uncertainty in the weighting of conditioning factors used for soil erosion, landslide, and flash flood susceptibility assessment. The method combines the Analytic Hierarchy Process with fuzzy logic by using Triangular Fuzzy Numbers (TFNs), allowing pairwise comparisons to be expressed as ranges rather than fixed numerical values (Saaty, 2008; Buckley, 1985; Chang, 1996).
Separate FAHP models were developed for each hazard type. Soil erosion susceptibility included slope, rainfall, TWI, soil type, curvature, land use/land cover (LULC), and distance to river. Flash flood susceptibility included rainfall, slope, drainage density, distance to river, TWI, soil type, and LULC. Landslide susceptibility included slope, lithology, rainfall, distance to river, LULC, soil type, curvature, and aspect. These parameters were selected according to their relevance to the geomorphological, hydrological, geological, and land-cover conditions of the Crnička Reka Catchment.
Pairwise comparison matrices were constructed using TFNs and a 9-point fuzzy linguistic scale (Table 4). Each fuzzy comparison was defined by lower, middle, and upper values, representing the uncertainty range of expert judgement.
|
Table 4. Linguistic variables with fuzzy and reciprocal fuzzy numbers. |
|||
|
Intensity of Importance |
Linguistic Variables |
TFN (l, m, u) |
Reciprocal TFN (1/u, 1/m, 1/l) |
|
1 |
Equal importance |
1,1,1 |
1,1,1 |
|
2 |
Intermediate values |
1,2,3 |
1/3,1/2,1 |
|
3 |
Weak importance |
2,3,4 |
1/4,1/3,1/2 |
|
4 |
Intermediate values |
3,4,5 |
1/5,1/4,1/3 |
|
5 |
Fairly strong importance |
4,5,6 |
1/6,1/5,1/4 |
|
6 |
Intermediate values |
5,6,7 |
1/7,1/6,1/5 |
|
7 |
Very strong importance |
6,7,8 |
1/8,1/7,1/6 |
|
8 |
Intermediate values |
7,8,9 |
1/9,1/8,1/7 |
|
9 |
Absolute importance |
9,9,9 |
1/9,1/9,1/9 |
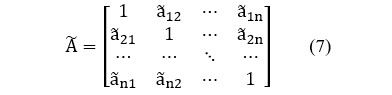
In the FAHP analysis, the pairwise comparison matrix was constructed using Triangular Fuzzy Numbers:
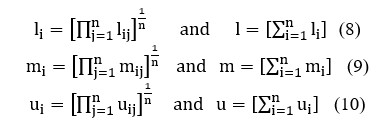
The fuzzy weights were calculated using Buckley’s geometric mean method. This approach calculates the geometric mean values for the lower, middle, and upper components of each criterion, followed by vector normalization:
The normalized fuzzy weights were then converted into crisp values using the Center of Area (COA) defuzzification method:

To evaluate the reliability of the pairwise comparisons, the Consistency Ratio (CR) was calculated (Cikmaz et al., 2025). Values below 0.10 were considered acceptable, indicating consistent expert judgement (Ghosh & Gope, 2021):

The Consistency Index was calculated using the principal eigenvalue and the number of criteria included in each FAHP matrix:

The Random Index (RI) values used for CR calculation were adopted from Saaty’s standard RI scale according to the number of criteria included in each FAHP matrix.
3. RESULTS
3.1. Erosion susceptibility assessment
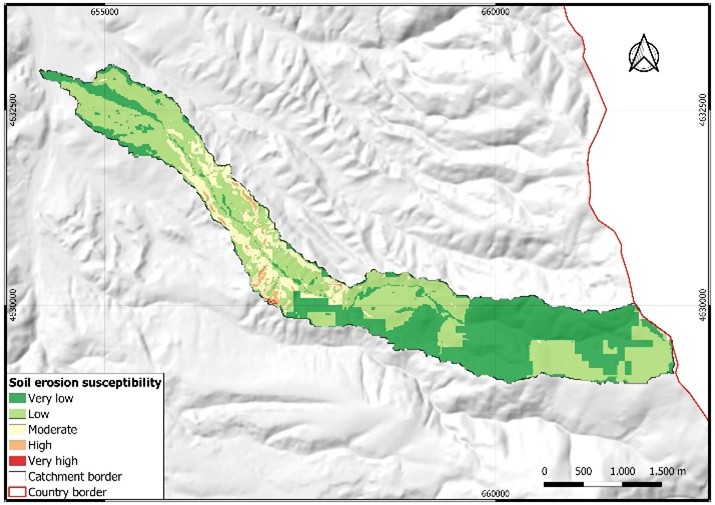
The EPM results indicate generally low to moderate erosion intensity in the Crnička Reka catchment, with an average erosion coefficient Z = 0.5. Most of the catchment falls below Z = 0.8, while 10.5% of the area exceeds this threshold, indicating zones of increased erosion susceptibility (Figure 6; Table 5). These higher-susceptibility zones are mainly associated with steeper slopes, sparse vegetation, and less resistant lithological and soil conditions.
|
Table 5. Erosion assessment modeling (according to Z coefficient values). |
|||
|
Class name |
Erosion coefficient Z |
Area (km²) |
Area (%) |
|
Very low |
0–0.4 |
2.9 |
43.3 |
|
Low |
0.4–0.8 |
3.1 |
46.2 |
|
Moderate |
0.8–1.2 |
0.6 |
9.4 |
|
High |
1.2–1.6 |
0.1 |
1.0 |
|
Very high |
<1.6 |
0.1 |
0.1 |
|
Total |
6.8 |
100.0 |
|
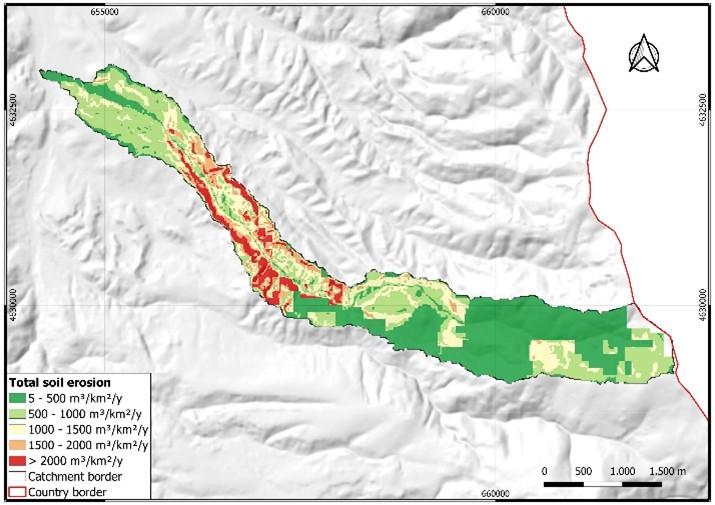
The estimated total sediment production is 5,304.0 m³/year, corresponding to a specific erosion rate of 780.9 m3/km2/year. Although very low and low erosion-rate classes dominate the catchment, high and very high erosion rates together cover 13.0% of the area (Figure 7; Table 6). The strongest erosion is concentrated in the lower part of the catchment near the village of Crnik, where specific erosion rates reach 2,100–3,400 m3/km2/year, compared with only 180–330 m3/km2/year in the source area. This downstream intensification reflects the combined influence of loose sediments, sparse vegetation, channel incision, and rainfall-driven runoff concentration.
|
Table 6. Classification of areas based on the amount of erosion. |
|||
|
Class name |
Class in m3/km2/year |
Area (km²) |
Area (%) |
|
Very low |
5.3–500 |
2.7 |
40.4 |
|
Low |
500-1000 |
2.0 |
29.2 |
|
Moderate |
1000–1500 |
1.2 |
17.4 |
|
High |
1500–2000 |
0.5 |
7.0 |
|
Very high |
<2000 |
0.4 |
6.0 |
|
Total |
6.8 |
6.8 |
|
3.2. Landslide susceptibility assessment
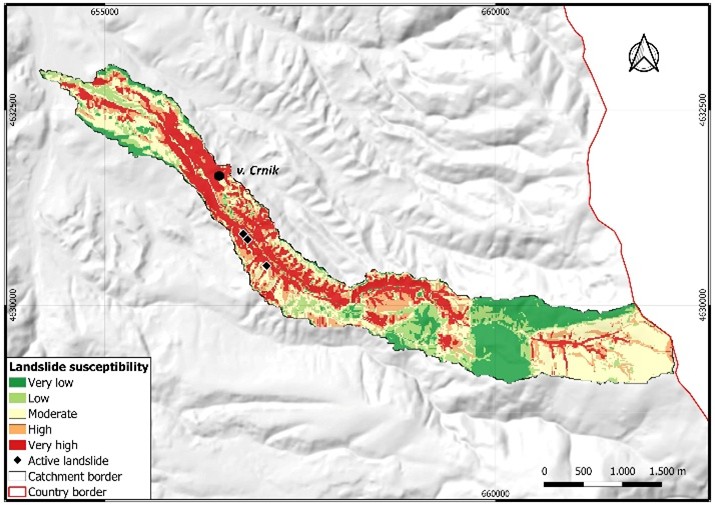
The LSI-based assessment indicates substantial landslide susceptibility within the Crnička Reka catchment, with 41.7% of the area classified as high or very high susceptibility (Figure 8; Table 7). These zones are mainly concentrated along steep valley slopes and in areas developed on weakly consolidated lacustrine and fluvial sediments, where slope instability is enhanced by rainfall, river undercutting, and sparse vegetation cover.
|
Table 7. Landslide susceptibility classes. |
||
|
Class Name |
Area (km²) |
Area (%) |
|
Very low |
1.5 |
21.4 |
|
Low |
0.9 |
12.8 |
|
Moderate |
1.6 |
24.1 |
|
High |
1.1 |
15.5 |
|
Very high |
1.8 |
26.2 |
|
Total |
6.8 |
100.0 |
Three major landslides and several smaller instability features were identified, mostly along valley slopes below approximately 1000 m a.s.l. Near the village of Crnik, two debris slides occur on the left valley side, with escarpments of about 30–50 m. Their development is closely related to weak sands, gravels, and sandstones, where water saturation during intense rainfall reduces material strength and promotes slope movement. Field investigations and drone-based DEM surveys from 2018 and 2024 show spatial correspondence between mapped landslides and very high susceptibility zones, supporting the reliability of the LSI model.
3.3. Flash flood susceptibility assessment
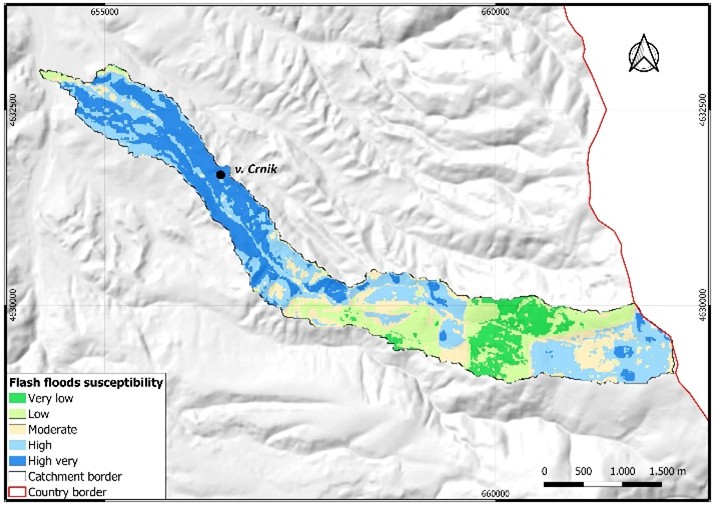
The FFPI-based assessment indicates pronounced flash flood susceptibility in the Crnička Reka catchment, with 57.4% of the area classified as high or very high susceptibility (Figure 9; Table 8). The most susceptible zones are concentrated mainly in the lower catchment, where intense rainfall, reduced infiltration, and runoff concentration increase flash flood potential.
|
Table 8. Flash floods susceptibility. |
||
|
Class Name |
Area (km²) |
Area (%) |
|
Very low |
0.6 |
9.4 |
|
Low |
1.2 |
17.5 |
|
Moderate |
1.1 |
15.7 |
|
High |
2.2 |
32.9 |
|
Very high |
1.7 |
24.5 |
|
Total |
6.8 |
100.0 |
These high-susceptibility areas correspond to sections developed on Luvisol, Leptosol, and Regosol soils, as well as Pliocene lacustrine-swamp sediments. Their weak permeability and limited resistance to surface runoff favour rapid hydrological response along the Crnička Reka channel.
3.4. Multi-hazard susceptibility assessment
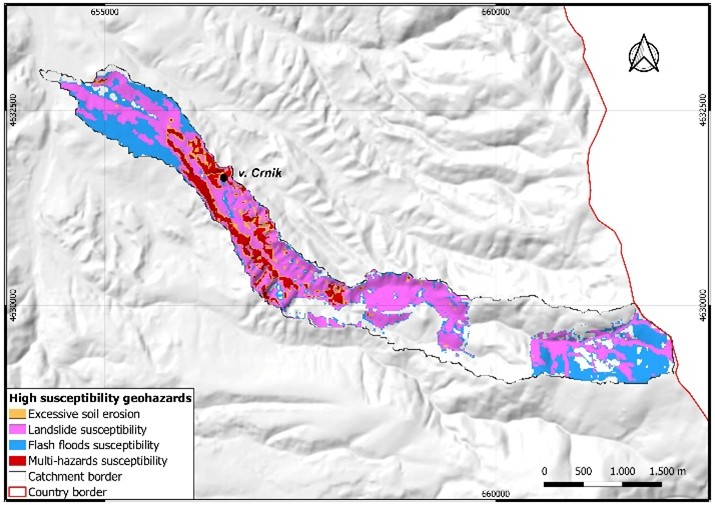
The overlay-based multi-hazard assessment indicates that 63.8% of the Crnička Reka Catchment is susceptible to at least one of the analysed hazards, while zones where multiple hazards overlap cover 6.3% of the total area (Figure 10; Table 9). These overlapping zones are mainly concentrated in the central and downstream sections of the catchment, where unstable lithology, steep valley slopes, sparse vegetation, and increased runoff potential occur together.
|
Table 9. Multi-geohazard susceptibility assessment. |
||
|
Geohazard |
Area (km²) |
Area (%) |
|
Excessive erosion |
0.6 |
8.6 |
|
Landslide susceptibility |
2.9 |
41.7 |
|
Flash floods susceptibility |
1.3 |
19.8 |
|
Multi-hazards susceptibility |
0.4 |
6.3 |
|
Total susceptibility |
4.4 |
63.8 |
|
Total |
6.8 |
100.0 |
Landslide susceptibility represents the dominant component of the multi-hazard pattern, followed by flash flood susceptibility and excessive erosion. Landslide-prone zones are mainly associated with steep slopes and clastic sediments, flash flood susceptibility is highest in downstream areas with concentrated runoff, while excessive erosion is linked to deforested or sparsely vegetated surfaces, Leptosol–Regosol soils, and weak sedimentary formations. The resulting map should therefore be interpreted as a spatial co-occurrence map of susceptibility zones, not as a dynamic model of cascading processes or temporal hazard interactions.
3.5. FAHP-based parameter weighting
The FAHP weighting results indicate that the three hazards are controlled by both common and process-specific factors. For soil erosion, the highest normalized weights were assigned to slope (0.34), rainfall (0.24), and TWI (0.16), showing that erosion susceptibility is mainly driven by terrain gradient, precipitation input, and runoff concentration. Flash flood susceptibility was primarily controlled by rainfall (0.35), slope (0.24), and drainage density (0.17), confirming the dominant role of hydro-meteorological forcing and rapid surface runoff. Landslide susceptibility was mainly influenced by slope (0.34), lithology (0.26), and rainfall (0.13), reflecting the importance of steep terrain, weak geological formations, and water-related triggering conditions.
These weighting patterns show that slope is the most consistent controlling factor across the catchment, while rainfall has a stronger influence on erosion and flash flood susceptibility (Sabljić et al., 2025). Lithology is particularly important for landslides, corresponding to the presence of weakly consolidated sediments and unstable valley slopes. Lower-weighted parameters, including LULC, soil type, curvature, aspect, and distance to river, contribute to local susceptibility variation but have a secondary role compared with the dominant controls.
The full pairwise comparison matrices and detailed fuzzy-weight tables were summarized in the main text to improve readability. The consistency analysis confirmed the reliability of the FAHP procedure, with CR values of 0.03 for landslides, 0.02 for soil erosion, and 0.03 for flash floods, all below the accepted threshold of 0.10. This indicates acceptable internal consistency of the pairwise comparisons and supports the use of the derived weights in GIS-based susceptibility modelling and subsequent multi-hazard overlay analysis.
3.6. FAHP-based geohazard susceptibility and multi-hazard overlay analysis
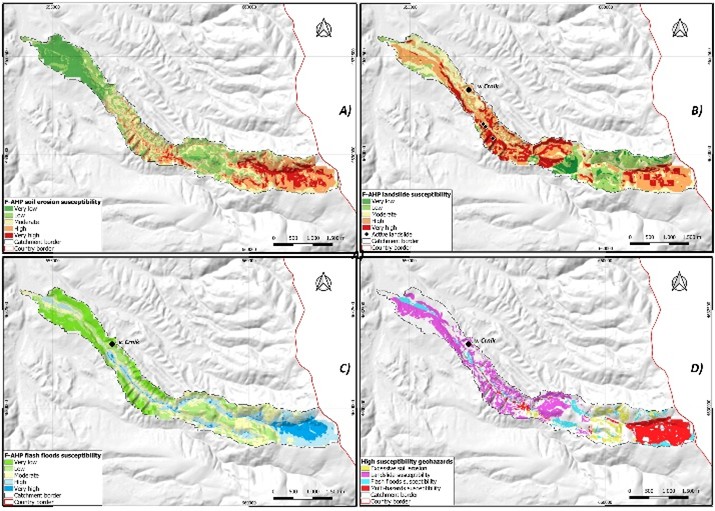
The FAHP-derived susceptibility maps show clear spatial differentiation among the analyzed hazards (Figure 11; Table 10). Flash flood susceptibility is the most extensive, with high and very high classes covering 44.8% of the catchment, mainly in hydrologically responsive areas where rainfall, slope, and drainage density favor rapid runoff generation. Landslide susceptibility is also significant, with 32.7% of the area classified as high or very high, primarily along steep and geologically unstable valley slopes. Soil erosion susceptibility is more spatially restricted, with high and very high classes covering 19.1%, reflecting the localized influence of slope, rainfall, TWI, soil conditions, and land-cover characteristics.
|
Table 10. Areas and proportional distribution of soil erosion, landslide susceptibility, and flash flood classes. |
||||||||
|
Class name |
Soil erosion |
Landslide |
Flash flood |
|||||
|
Area (km2) |
Area (%) |
Area (km2) |
Area (%) |
Area (km2) |
Area (%) |
|||
|
Very low |
1.80 |
26.5 |
1.27 |
18.7 |
0.95 |
14 |
||
|
Low |
2.10 |
30.9 |
1.57 |
23.0 |
1.40 |
20.6 |
||
|
Moderate |
1.60 |
23.5 |
1.74 |
25.6 |
1.40 |
20.6 |
||
|
High |
1.00 |
14.7 |
1.61 |
23.7 |
1.90 |
27.9 |
||
|
Very high |
0.30 |
4.4 |
0.61 |
9.0 |
1.15 |
16.9 |
||
|
Total |
6.8 |
100.0 |
6.8 |
100.0 |
6.8 |
100.0 |
||
The FAHP-based multi-hazard overlay indicates that 51.0% of the catchment is susceptible to at least one hazard, while overlapping multi-hazard zones cover 15.4% of the total area (Figure 11; Table 11). These zones are mainly concentrated in headwater and steep valley sections, where terrain instability, runoff concentration, and erosion-prone surfaces coincide. The results suggest that these areas should be prioritized for mitigation measures, particularly slope stabilization, afforestation, erosion control, and runoff management.
|
Table 11. Areas distribution of multi-hazard susceptibility components. |
||
|
Geo-hazards |
Area (km2) |
Area (%) |
|
Soil erosion |
0.4 |
5.4 |
|
Landslide |
1.6 |
23.1 |
|
Flash floods |
0.5 |
7.1 |
|
Multi-hazards |
1.0 |
15.4 |
|
Total susceptibility |
3.5 |
51.0 |
|
Total |
6.8 |
100.0 |
The multi-hazard map should be interpreted as an overlay-based susceptibility assessment, not as a dynamic model of cascading or time-dependent hazard interactions. Nevertheless, it provides a practical spatial basis for identifying priority zones in a small, data-limited catchment where multiple geomorphic and hydrological processes overlap. The consistency analysis confirms the reliability of the FAHP weighting procedure, as all CR values range between 0.02 and 0.03, well below the accepted threshold of 0.10 (Table 12).
|
Table 12. Consistency analysis results of Fuzzy AHP models for susceptibility areas. |
|||||
|
Geohazard |
n |
λ |
CI |
RI |
CR |
|
Landslide |
8 |
8.32 |
0.05 |
1.41 |
0.03 |
|
Soil erosion |
7 |
7.17 |
0.03 |
1.32 |
0.02 |
|
Flash floods |
7 |
7.24 |
0.04 |
1.32 |
0.03 |
3.7. ROC-AUC validation
Model performance was evaluated using ROC curves and AUC percentages for landslide and flash-flood susceptibility (Figure 12). The GIS-based parameter models showed higher predictive accuracy than the FAHP models. The LSI landslide model achieved 85.1%, while the FAHP landslide model reached 76.7%. For flash floods, the FFPI model achieved 84.2%, compared with 72.2% for the FAHP model.
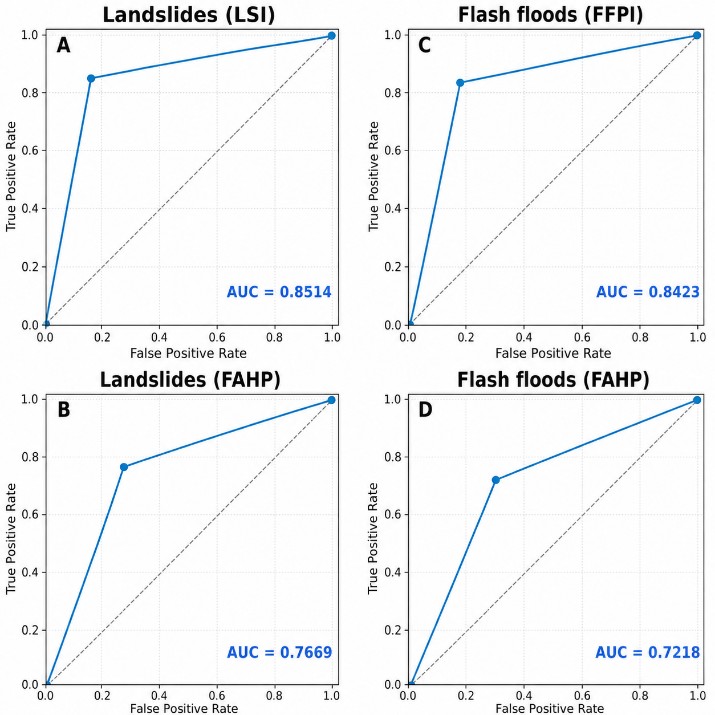
The higher performance of LSI and FFPI indicates that the parameter-based GIS models better captured the observed hazard distribution. This is mainly because their conditioning factors and class weights were defined using process-specific geohazard criteria, field observations, local terrain interpretation, and the judgement of five experts involved in parameter weighting. The FAHP models, although methodologically consistent, apply broader fuzzy multi-criteria weighting and therefore produce more generalized susceptibility patterns than the process-specific models. Thus, the parameter-based models performed better for hazard-specific prediction, while FAHP provided complementary information for identifying wider zones of combined susceptibility.
4. DISCUSSION
The Crnička Reka catchment represents a small but highly sensitive geomorphic system where erosion, mass movements, and flash-flood susceptibility result from the interaction of steep slopes, weak lithology, sparse vegetation, and rainfall-driven runoff. Although the catchment covers only 6.8 km2, its elongated morphology and fan-shaped sections favour runoff concentration, sediment transfer, and slope instability. Therefore, the identified susceptibility pattern is not controlled by catchment size alone, but by the local convergence of terrain, lithology, hydrology, and land-cover conditions, as also emphasized in recent GIS-based multi-hazard studies (Aleksova et al., 2023; Aleksova et al., 2024b,c; Milevski et al., 2024; Di Salvo et al., 2024).
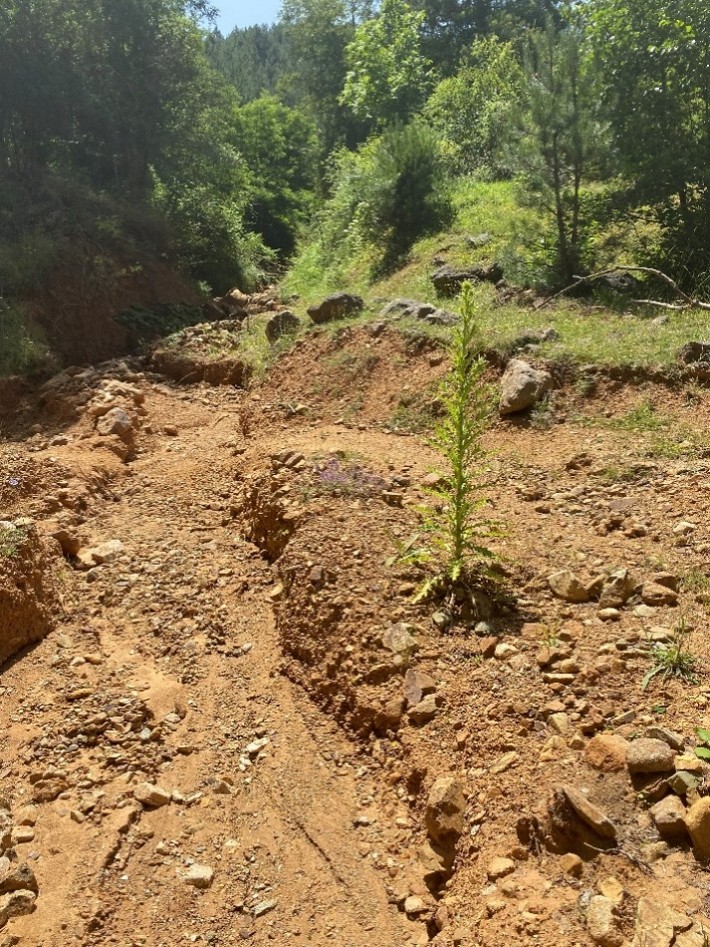
For soil erosion, the EPM results indicate moderate overall intensity, but the internal spatial contrast is more important than the mean value. Total erosion production reaches 5,304 m3/year, with a specific erosion rate of 780.9 m3/km2/year, compared with 925 m3/km2/year reported for the wider Bregalnica catchment (Milevski, 2008; Milevski, 2011). Within Crnička Reka, erosion rates increase from 180–330 m3/km2/year in the source area to 2,100–3,400 m3/km2/year near Crnik. Estimated surface lowering of 1–3 mm/year, together with sediment accumulation and channel incision, confirms that the lower valley acts as the main erosion and sediment-transfer zone (Figure 13). Similar EPM-based interpretations of erosion intensity and sediment production have been reported in recent studies (Bezak et al., 2024; Milevski et al., 2025a; Aleksova et al., 2024b).
The LSI model classifies 41.7% of the catchment as high to very high susceptibility. Rainfall acts as a triggering factor by increasing saturation and reducing shear strength, while river undercutting and land-use change further destabilize lower slope sections (Milevski, 2004; Kenderova & Milevski, 2010; Milevski et al., 2024). Field investigations from 2018 to 2025 confirmed three active landslides within very high susceptibility zones, supporting the spatial reliability of the LSI output. The FFPI model classifies 57.4% of the catchment as high to very high susceptibility. River-channel displacement of 0.5 - 6 m and incision into weak sediments further increase flood susceptibility by concentrating runoff along unstable channel sections. These findings are consistent with recent studies (Popescu & Bărbulescu, 2023; Shawaqfah et al., 2024; Aleksova et al., 2025; Milevski et al., 2025b).
The FAHP weighting results help explain the methodological differences between the models. Rainfall and slope dominate across the analyzed hazards, confirming the hydro-geomorphic sensitivity of the catchment and the importance of rainfall-driven instability under changing precipitation regimes (IPCC, 2023; Skilodimou et al., 2019; Taoukidou et al., 2025). For landslides, slope (0.34) and lithology (0.26) are the dominant parameters, consistent with studies identifying terrain steepness and geological weakness as primary controls of slope failure (Akinci et al., 2015; Zighmi et al., 2025; Katapodi & Antoniou, 2025). For flash floods, rainfall (0.35), slope (0.24), and drainage density (0.17) dominate, confirming the importance of precipitation input and drainage response in rapid runoff generation (Marchi et al. 2010; Dursun & Babalik, 2023).
The comparison between parametric models and FAHP shows that the approaches are complementary but not equivalent. For erosion, FAHP identifies 19.1% of the catchment as highly susceptible, compared with 8.6% from EPM, reflecting its greater sensitivity to the combined influence of rainfall, curvature, TWI, soil type, and land cover, while EPM remains more appropriate for estimating erosion magnitude and sediment production. Field evidence from Crnička Reka, including “melovi” or badland forms, confirms intense erosion within highly erodible sediments (Milevski, 2004; Kenderova & Milevski, 2010; Milevski & Ivanova, 2013). For landslides, LSI and FAHP show closer agreement because both emphasize slope and lithology, with 41.7% and 32.7% of the catchment classified as high to very high susceptibility, respectively. For flash floods, FFPI identifies 57.4% high to very high susceptibility, compared with 44.8% from FAHP, indicating that FFPI is more sensitive to direct runoff-producing conditions. ROC-AUC validation further confirms that the parameter-based models performed better, as their weights were supported by expert judgement and field-based interpretation, whereas FAHP produced broader and more generalized susceptibility patterns.
Comparison with national-scale studies confirms methodological consistency, but also highlights the local sensitivity of the Crnička Reka catchment. National EPM assessments report Z = 0.36 and about 9.6% high erosion susceptibility, whereas Crnička Reka reaches 780.9 m3/km2/year, approximately 51.2% above the national average, indicating stronger local geomorphic and climatic controls (Djordjević et al., 1993; Aleksova et al., 2023; Milevski et al., 2024). For landslides, the national AHP-LSI estimate of 41.7% high and very high susceptibility closely matches the LSI result for Crnička Reka (Milevski et al., 2019; Milevski et al., 2024). For flash floods, national FFPI assessments report 25.6% high susceptibility, while cloud-based national modelling gives 45.4%; the higher local values in Crnička Reka reflect the influence of steep slopes, weak sediments, and rapid runoff concentration (Aleksova et al., 2025; Milevski et al., 2025b).
The multi-hazard assessment should be interpreted as a spatial overlay of independently modelled susceptibility maps, not as a dynamic simulation of cascading processes, triggering sequences, or temporal interactions. This is an important limitation. The parametric overlay identifies 6.3% of the catchment as overlapping high-susceptibility zones, whereas FAHP identifies a larger multi-hazard area of 15.4%. This difference results from FAHP’s higher sensitivity to combined factors such as rainfall, TWI, drainage density, and land-cover conditions. Thus, the parametric overlay is more conservative and process-specific, while the FAHP overlay is more suitable for identifying broader zones of combined susceptibility (Skilodimou et al., 2019; Katapodi & Antoniou, 2025; Di Salvo et al., 2024).
The main limitations remain the lack of long-term landslide inventories, hydrological event records, and sediment-monitoring data, while future research should include UAV surveys, expanded landslide and flash-flood inventories, rainfall-event observations, and sediment-transport monitoring to support the transition from overlay-based susceptibility mapping toward dynamic multi-hazard analysis.
5. CONCLUSIONS
This study evaluated multi-hazard susceptibility in the Crnička Reka catchment through the comparative application of GIS-based parametric models and FAHP. Individual susceptibility to excessive soil erosion, landslides, and flash floods was first assessed separately, followed by an integrated multi-hazard interpretation. The results indicate that, despite its small size, the catchment is highly sensitive to geohazards due to the combined influence of steep slopes, weak lithological units, soil associations, sparse vegetation cover, and rainfall-driven runoff. The highest susceptibility is concentrated in the central and lower parts of the basin, where unstable slopes, erodible sediments, reduced vegetation cover, and runoff concentration coincide.
The comparison between the parametric models and FAHP confirms that the two approaches provide complementary information. The GIS-based parametric models showed stronger performance for hazard-specific prediction, whereas FAHP was more effective in identifying broader zones where multiple conditioning factors overlap. This demonstrates the value of combining process-specific modelling with multi-criteria analysis in small mountainous catchments where erosion, landslides, and flash floods develop within the same geomorphic system.
From a risk-management perspective, the central and lower parts of the catchment should be considered priority areas for mitigation. Appropriate measures include slope stabilization, afforestation, erosion-control structures, runoff regulation, and restrictions on land-use practices that increase surface instability. Although LULC received a lower FAHP weight, its influence remains evident in sparsely vegetated and degraded areas, confirming the importance of vegetation cover for reducing erosion, improving slope stability, and limiting rapid runoff response (Taoukidou et al., 2025; Dursun, 2025).
Future research should focus on moving beyond overlay-based susceptibility mapping toward more dynamic multi-hazard assessment. This could be achieved by coupling susceptibility models with hydrological and hydraulic modelling of peak runoff, peak discharge, flow accumulation, channel response, and sediment transport. Cloud-based workflows in GEE could support reproducible validation and comparison using CHIRPS maximum rainfall intensity, ERA5-Land climate variables, Sentinel-based land-cover dynamics, and updated DEM-derived parameters. UAV-based modelling and LiDAR data would further improve the spatial resolution of slope, curvature, drainage density, channel incision, and erosion-form mapping. These improvements would strengthen quantitative validation and provide a stronger basis for operational flash-flood, erosion, and landslide risk management in small mountainous catchments.
REFERENCES
- Akıncı, H., Yavuz Özalp, A., Özalp, M., Temuçin Kılıçer, S., Kılıçoğlu, C. & Everan, E., 2015. Production of landslide susceptibility map using Bayesian probability model. International Journal of 3-D Information Modeling, 4(2), 16–33. https://doi.org/10.4018/IJ3DIM.2015040102
- Aleksova, B., Milevski, I. & Stefanidis, S., 2025. Flash flood potential index at national scale: Susceptibility assessment within catchments. Open Geosciences, 17(1), 20250891. https://doi.org/10.1515/geo-2025-0891
- Aleksova, B., Lukić, T., Milevski, I., Puhar, D. & Marković, S.B., 2024a. Preliminary assessment of geohazards’ impacts on geodiversity in the Kratovska Reka catchment (North Macedonia). Geosciences, 14(3), 62. https://doi.org/10.3390/geosciences14030062
- Aleksova, B., Lukić, T., Milevski, I., Spalević, V. & Marković, S.B., 2023. Modelling Water Erosion and Mass Movements (Wet) by Using GIS-Based Multi-Hazard Susceptibility Assessment Approaches: A Case Study—Kratovska Reka Catchment (North Macedonia). Atmosphere, 14, 1139. https://doi.org/10.3390/atmos14071139
- Aleksova, B., Milevski, I., Dragičević, S. & Lukić, T., 2024b. GIS-Based Integrated Multi-Hazard Susceptibility Assessment in Makedonska Kamenica Municipality, North Macedonia. Atmosphere, 15, 774. https://doi.org/10.3390/atmos15070774
- Aleksova, B., Milevski, I., Mijalov, R., Marković, S., Cvetković, V. & Lukić, T., 2024c. Assessing risk-prone areas in the Kratovska Reka catchment (North Macedonia) by integrating advanced geospatial analytics and flash flood potential index. Open Geosciences, 16(1), 20220684. https://doi.org/10.1515/geo-2022-0684
- Beigh, I.H. & Bukhari, S.K., 2024. Landslide susceptibility assessment using GIS-based multicriteria decision analysis (MCDA) along a part of National Highway-1, Kashmir-Himalayas, India. Appl. Geomat., 16, 451–469. https://doi.org/10.1007/s12518-024-00559-6
- Bezak, N., Borrelli, P., Mikoš, M., Auflič, M.J. & Panagos, P., 2024. Towards Multi-Model Soil Erosion Modelling: An Evaluation of the Erosion Potential Method (EPM) for Global Soil Erosion Assessments. Catena, 234, 107596.
- Buckley, J.J., 1985. Fuzzy hierarchical analysis. Fuzzy Sets and Systems, 17(3), 233–247.
- Bytyqi, V. & Agaj, T., 2024. Spatial estimation of soil erosion using geospatial technique – a case study of Janjeva River catchment (Kosovo). Carpathian Journal of Earth and Environmental Sciences, 19(2), 233–243. https://doi.org/10.26471/cjees/2024/019/294
- Chang, D.Y., 1996. Applications of the extent analysis method on fuzzy AHP. European Journal of Operational Research, 95(3), 649–655.
- Cikmaz, B.A., Yildirim, E. & Demir, I., 2025. Flood susceptibility mapping using fuzzy analytical hierarchy process for Cedar Rapids, Iowa. International Journal of River Basin Management, 23(1), 1–13.
- Copernicus Climate Change Service (C3S), 2019. ERA5-Land hourly data from 1950 to present. Copernicus Climate Data Store. https://doi.org/10.24381/cds.e2161bac
- CORINE Land Cover, 2018. Copernicus Land Monitoring Service. In Technical Report, Office for Official Publications of the European Communities: Luxembourg, 2016.
- Di Salvo, C., Ciotoli, G., Mancini, M., Nisio, S. & Stigliano, F., 2024. Analysis of Geological Multi-Hazards in an Urban District. Geosciences, 14(2), 27. https://doi.org/10.3390/geosciences14020027
- Djordjević, M., Trendafilov, A., Jelić, D., Georgievski, S. & Popovski, A., 1993. Erosion map of the Republic of Macedonia - textual part. Skopje: Water Development Institute, p. 89. (in Macedonian).
- Dursun, İ. & Babalik, A.A., 2023. Burdur Gölü Havzasındaki morfometrik parametrelerin ve erozyon durumunun değerlendirilmesi. Turkish Journal of Forestry, 24(1), 25–38.
- Dursun, İ., 2025. An integrated analytical approach to sub-watershed prioritization and erosion risk assessment in the Salda Lake Basin, Türkiye. Environmental Earth Sciences, 84(15), 428.
- Dubey, A.K., Anjum, M. & Kumar, A., 2025. A geo-spatial approach for evaluating and mitigating flood vulnerability in Biraul Sub-division of Darbhanga District, Bihar. Carpathian Journal of Earth and Environmental Sciences, 20(2), 399–412. https://doi.org/10.26471/cjees/2025/020/342
- FAO, 2015. Soil Map of the Republic of Macedonia, 50k. FAO, Rome, Italy, and Agricultural Institute-UKIM, Skopje, North Macedonia. (In Macedonian).
- Gavrilović, S., 1972. Engineering of Torrents and Erosion. J. Constr., 292. (In Serbian).
- Ghosh, M. & Gope, D., 2021. Hydro-morphometric characterization and prioritization of sub-watersheds for land and water resource management using fuzzy analytical hierarchical process (FAHP): a case study of upper Rihand watershed of Chhattisgarh State, India. Applied Water Science, 11(2), 17.
- Gopinath, G., Jesiya, N., Achu, A.L., Bhadran, A. & Surendran, U.P., 2024. Ensemble of fuzzy-analytical hierarchy process in landslide susceptibility modeling from a humid tropical region of Western Ghats, Southern India. Environmental Science and Pollution Research, 31(29), 41370–41387.
- Gorsevski, P.V. & Milevski, I., 2026. Multilevel flood susceptibility mapping by fuzzy sets, analytical hierarchy process, weighted linear combination and random forest. ISPRS International Journal of Geo-Information, 15(4), 148. https://doi.org/10.3390/ijgi15040148
- Hanane, M., Naïma, E.A. & Charaf Eddine, B., 2024. Quantification of water erosion using the RUSLE method in the Mazer watershed (Berrechid region, Morocco). E3S Web Conf., 489, 04013.
- IPCC, 2023. Climate Change 2021. The Physical Science Basis: Working Group I Contribution to the Sixth Assessment Report of the Intergovernmental Panel on Climate Change. Cambridge University Press, Cambridge. https://doi.org/10.1017/9781009157896
- Karajovanović, M., Hristov, S., Jančevski, J.U. & Ivanova, V., 1976. Interpreter on the basic one Geological Map of SFRY, Kratovo and Kyustendil, 100k. Fed. Geol. Plant Belgrade. (In Macedonian)
- Katapodi, E. & Antoniou, V., 2025. Assessing Geohazards on Lefkas Island, Greece: GIS-Based Analysis and Public Dissemination Through a GIS Web Application. Applied Sciences, 15(14), 7935. https://doi.org/10.3390/app15147935
- Kenderova, R. & Milevski, I., 2010. Geomorphological Studies of Erosion Forms in Vlaina Mountain (in the Territory of Bulgaria and Macedonia). In: Proceedings from the Conference of BAS-Geography and Regional Development, Sofia, pp. 473–480.
- Kovačević, M. & Rakičević, T., 1973. Interpreter of the Geological Map Sheet Delčevo K34-82, 100k, based on the Geological Map of the SFRY. Geological Institute Belgrade.
- Li, J., He, W., Qiu, L., Zeng, W. & Di, B., 2024. Landslide Susceptibility Assessment Based on Machine Learning Techniques. In: Sarkar, R., Saha, S., Adhikari, B.R. & Shaw, R. (eds) Geomorphic Risk Reduction Using Geospatial Methods and Tools. Springer, Singapore. https://doi.org/10.1007/978-981-99-7707-9_1
- Marchi, L., Borga, M., Preciso, E. & Gaume, E., 2010. Characterisation of selected extreme flash floods in Europe and implications for flood risk management. Journal of Hydrology, 394(1–2), 118–133. https://doi.org/10.1016/j.jhydrol.2010.07.017
- Milevski, I., 2004. Recent erosion in the Želevica catchment. Bulletin of the Department of Physical Geography, 59–76. Skopje, Republic of Macedonia.
- Milevski, I., 2008. Estimation of soil erosion risk in the upper part of Bregalnica watershed - Republic of Macedonia, based on digital elevation model and satellite imagery. In: Proceedings of the 5th International Conference on Geographic Information Systems (ICGIS-2008), 2–5 July 2008, Fatih University, Istanbul, Turkey.
- Milevski, I., 2011. Factors, Forms, Assessment and Human Impact on Excess Erosion and Deposition in Upper Bregalnica Watershed (Republic of Macedonia). Zeitschrift für Geomorphologie Supplementary Issues, 55, 77–94.
- Milevski, I. & Ivanova, E., 2013. Erosion potential modeling of the territory of municipalities Pehchevo and Simitli using remote sensing data. In: Proceedings of the Scientific Conference with International Participation: Space, Ecology, Safety (SES), Vol. 1, Sofia, November 2013.
- Milevski, I. & Ivanova, E., 2016. GIS- and RS-Based Modelling of Potential Natural Hazard Areas in Mountains. Case Study: Vlahina Mountain. In: Koulov, B., Zhelezov, G. (eds) Sustainable Mountain Regions: Challenges and Perspectives in Southeastern Europe. Springer, Cham. https://doi.org/10.1007/978-3-319-27905-3_14
- Milevski, I., Aleksova, B. & Dragićević, S., 2025a. UAV-Based Survey of the Earth Pyramids at the Kuklica Geosite (North Macedonia). Heritage, 8(1):6. https://doi.org/10.3390/heritage8010006
- Milevski, I., Aleksova, B., Lukić, T., Dragićević, S. & Valjarević, A., 2024. Multi-hazard modeling of erosion and landslide susceptibility at the national scale in the example of North Macedonia. Open Geosciences, 16(1), 20220718. https://doi.org/10.1515/geo-2022-0718
- Milevski, I., Dragičević, S. & Georgievska, A., 2013a. GIS and RS-Based Modelling of Potential Natural Hazard Areas in Pehčevo Municipality, Republic of Macedonia. Journal of the Geographical Institute Jovan Cvijic SASA, 63(3), 95–107. https://doi.org/10.2298/IJGI1303095M
- Milevski, I., Dragičević, S. & Tošić, R., 2013b. GIS and remote sensing assessment of erosion risk areas in Pehchevo Municipality. In: Conference Hilly-Mountain Areas - Problems and Perspectives, September 2013, Ohrid, Republic of Macedonia.
- Milevski, I., Dragičević, S. & Zorn, M., 2019. Statistical and expert-based landslide susceptibility modeling on a national scale applied to North Macedonia. Open Geosciences, 11(1), 750–764. https://doi.org/10.1515/geo-2019-0059
- Milevski, I., Aleksova, B., Valjarević, A. & Gorsevski, P., 2025b. Cloud-Based Assessment of Flash Flood Susceptibility, Peak Runoff, and Peak Discharge on a National Scale with Google Earth Engine (GEE). Atmosphere, 16(8), 945. https://doi.org/10.3390/atmos16080945
- Mokarram, M., Pourghasemi, H.R., Tiefenbacher, J.P. & Pham, T.M., 2024. Mapping soil erosion susceptibility: a comparison of neural networks and fuzzy-AHP techniques. Environmental Earth Sciences, 83(19), 564.
- Popescu, N.-C. & Bărbulescu, A., 2023. Flood Hazard Evaluation Using a Flood Potential Index. Water, 15(20), 3533. https://doi.org/10.3390/w15203533
- Pourghasemi, H.R., Kariminejad, N., Amiri, M., Edalat, M., Zarafshar, M., Blaschke, T. & Cerda, A., 2020. Assessing and mapping multi-hazard risk susceptibility using a machine learning technique. Scientific Reports, 10, 3203.
- Sabljić, L., Lukić, T., Bajić, D., Marković, S., Spalevic, V., Cvetković, V., Delić, D., Adžić, D., Aleksova, B., Milevski, I. & Srzentić, G., 2025. Spatio-temporal analysis of flood events using GIS and remote sensing-based approach in the Ukrina River Basin, Bosnia and Herzegovina. Open Geosciences, 17(1), 20250856. https://doi.org/10.1515/geo-2025-0856
- Saaty, T.L., 2008. Decision making with the analytic hierarchy process. International Journal of Services Sciences, 1(1), 83–98.
- Sassa, S., 2023. Landslides and Tsunamis: Multi-Geohazards. Landslides, 20, 1335–1341. https://doi.org/10.1007/s10346-023-02084-w
- Shawaqfah, M., Ababneh, Y., Odat, A.-S.A., Almomani, F., Alomush, A., Abdullah, F. & Almasaeid, H.H., 2024. Flash Flood Potential Analysis and Hazard Mapping of Wadi Mujib Using GIS and Hydrological Modelling Approach. Water, 16, 1918. https://doi.org/10.3390/w16131918
- Skilodimou, H.D., Bathrellos, G.D., Chousianitis, K., Youssef, A.M. & Pradhan, B., 2019. Multi-hazard assessment modeling via multi-criteria analysis and GIS: A case study. Environmental Earth Sciences, 78, 47.
- Smith, G.E., 2003. Flash flood potential: Determining the hydrologic response of FFMP basins to heavy rain by analyzing their physiographic characteristics. Available online: http://www.cbrfc.noaa.gov/papers/ffp_wpap.pdf (accessed on 12 December 2024).
- Sousa, J.J., Liu, G., Fan, J., Perski, Z., Steger, S., Bai, S., Wei, L., Salvi, S., Wang, Q., Tu, J., Tong, L., Mayrhofer, P., Sonnenschein, R., Liu, S., Mao, Y., Tolomei, C., Bignami, C., Atzori, S., Pezzo, G. et al., 2021. Geohazards Monitoring and Assessment Using Multi-Source Earth Observation Techniques. Remote Sensing, 13(21), 4269. https://doi.org/10.3390/rs13214269
- Sud, A., Sajan, B., Kanga, S., Singh, S.K., Singh, S., Durin, B., Kumar, P., Meraj, G., Sahariah, D., Debnath, J. et al., 2024. Integrating RUSLE model with cloud-based geospatial analysis: A Google Earth Engine approach for soil erosion assessment in the Satluj Watershed. Water, 16, 1073.
- Taoukidou, N., Karpouzos, D. & Georgiou, P., 2025. Flood Hazard Assessment Through AHP, Fuzzy AHP, and Frequency Ratio Methods: A Comparative Analysis. Water, 17(14), 2155. https://doi.org/10.3390/w17142155
- UNDRR, 2025. The multi-hazard concept in disaster risk reduction. United Nations Office for Disaster Risk Reduction. Available at: https://www.undrr.org/ (accessed on 2 February 2025).
- Vujačić, D., Milevski, I., Mijanović, D., Vujović, F. & Lukić, T., 2023. Initial results of comparative assessment of soil erosion intensity using the WIntErO model: A case study of Polimlje and Shirindareh drainage basins. Carpathian Journal of Earth and Environmental Sciences, 18(2), 267–280. https://doi.org/10.26471/cjees/2023/018/267
- Zhang, Z. & Sun, J., 2024. Regional Landslide Susceptibility Assessment and Model Adaptability Research. Remote Sensing, 16, 2305. https://doi.org/10.3390/rs16132305
- Zighmi, K., Zahri, F., Faqeih, K., Al Amri, A., Riheb, H., Alamri, S.M. & Alamery, E., 2025. AHP multi criteria analysis for landslide susceptibility mapping in the Tellian Atlas chain. Scientific Reports, 15(1), 25747.