1. INTRODUCTION
Soil erosion is a major global threat causing land degradation and affecting freshwater and marine environments (Borrelli et al., 2020; Montanarella et al., 2016; Panagos et al., 2015). It constitutes a significant risk to global food security by markedly reducing regional agricultural productivity, which in turn causes landscape degradation and a loss of soil microbial biodiversity (Guerra et al., 2020; Li et al., 2025). Soil erosion causes many negative agronomic, environmental and economic impacts, reducing local soil productivity and fertility and causing pollution and sedimentation off-site (Blanco & Lal, 2008; Lal, 2017). It not only removes nutrient-rich topsoil but also leads to the sedimentation of rivers, reduced agricultural productivity, and altered hydrological cycles (Borrelli et al., 2020). The erosion map offers a comprehensive understanding of the spatial distribution of erosion intensity categories and serves as a critical basis for integrated water management, soil conservation, forest ecosystem protection, environmental preservation, spatial planning, agricultural development, and other human activities (Tošić et al., 2025).
Slope gradient has been identified as one of the dominant topographic factors controlling soil erosion dynamics (Huang et al., 2020; Koulouri & Giourga, 2007). Steeper slopes tend to increase runoff velocity and erosive power, leading to greater soil detachment and sediment transport (Wischmeier & Smith, 1978). At the same time, many previous studies have shown that land-use type has a significant impact on soil erosion (Huang et al., 2020; Wei et al., 2007). Changes in human land use have influenced soil erosion for thousands of years, leading to significant impacts on both terrestrial and aquatic ecosystems, as well as on biogeochemical cycles connecting land and ocean (Mazure et al., 2024). The study by Luo et al., (2022) indicated that land-use types were the primary factors directly modifying soil physical and chemical properties, and further affected the sensitivity of soil erosion (Ascencio-Sanchez et al., 2025) revealed the transition from forest to farmland in a sub-basin of the Peruvian Amazon was related to the most critical erosion values. Their study highlighted that unsustainable soil management, along with social and landscape changes, contributes to alterations in soil chemical and physical properties.
In Vietnam, soil erosion is a serious environmental challenge in mountainous areas, particularly in the Northern region, where the terrain is steep, the landforms are strongly dissected, rainfall is heavy, and vegetation cover is uneven (Siem & Phien, 1999). This process contributes directly to land degradation and negatively impacts both farm productivity and environmental quality (Dung & Ky, 2012). Numerous studies in Vietnam have used the Universal Soil Loss Equation (USLE) or Revised Universal Soil Loss Equation (RUSLE) model combined with geographic information systems (GIS) or remote sensing to estimate the level of erosion, and analyze the relationship between erosion and factors such as slope, land cover, rainfall, land use and climate conditions (Au, 2016; Dung & Ky, 2012; Ha et al., 2013; Hien & Vinh, 2017; Hoc et al., 2019; Nguyen et al., 2025). However, most research has focused on single factors, small catchments, or short time frames, and there is a lack of integrated studies that simultaneously assess slope gradients and land-use types in large river basins in northern Vietnam. In particular, spatially explicit analyses linking erosion risk with different land uses across slope classes are limited, and few studies incorporate detailed field measurements to validate model predictions. To address these gaps, this study evaluates soil erosion in the Song Cong basin, linking slope gradients and land-use types within a GIS framework to quantify erosion patterns, analyze how land use modifies slope-erosion relationships, and provide guidance for spatial prioritization of soil and water conservation.
2. METHODS
2.1. Study area
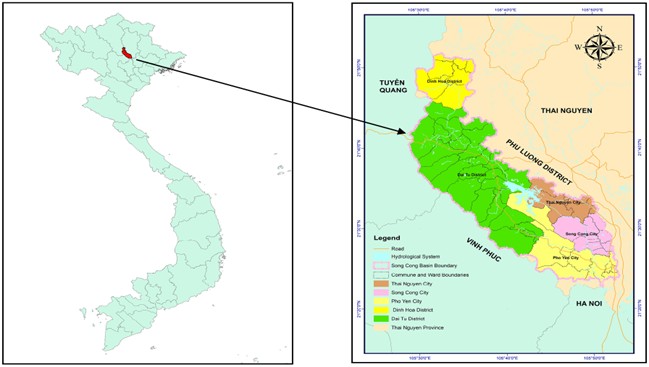
The Song Cong basin is an important sub-basin in the northern midland region of Vietnam and forms part of the upstream catchment of the Cau River system. It covers an area of 93,621.14 ha and extends from 21°51'5" to 21°19'34" N latitude and from 105°28'42" to 105°53'30" E longitude (Figure 1). Its geographical setting contributes to considerable natural heterogeneity while simultaneously presenting substantial challenges for the effective management and utilization of water resources.
The Song Cong basin in Thai Nguyen Province encompasses 85,487.5 ha of natural land and, prior to July 1, 2025, spans five administrative divisions within the province. Dai Tu District accounts for the largest proportion of the basin’s area, with 44,854.346 ha (52.4%), followed by Dinh Hoa District with 10,044.04 ha (11.8%), Pho Yen City with 15,724.184 ha (18.4%), Thai Nguyen City with 7,498.15 ha (8.8%), and Song Cong City with 7,366.78 ha (8.6%). The basin is located in a tropical monsoon climate zone, characterized by clearly differentiated rainy and dry seasons. The mean annual rainfall ranges between 1,200 and 1,800 mm, with the majority of precipitation concentrated from May to September. The topography of the Song Cong basin exhibits clear elevation differentiation, resulting in diverse land-use characteristics. The low and mid-relief dominated area under 200 m makes up more than 78% of the basin, serving as a focal area for the agricultural activities and infrastructure development. The mid-upland zone (200-600 m), accounting for about 16.01% and scattered in Dai Tu District and Dinh Hoa District, can be used for perennial crops and forestry. In contrast, areas above 600 m constitute 5.15% of the upstream area along the Tam Dao range, a steep mountainous region that is essential for watershed protection and forest conservation. This vertical zonation has led to potential land-use diversification, but it also demands suitable farming practices for the sustainability of livelihoods. Plowing on steep slopes, deforestation, and conversion of forest land to agriculture have exacerbated erosion risk in recent decades.
2.2. Data collection
Rainfall data (2013-2023) were obtained from the Centre for Meteorology, Hydrology and Remote Sensing. Soil maps (1:50,000) and related attributes such as soil texture and organic matter content were used to determine the soil erodibility factor (K-factor). Digital Elevation Model (DEM) data with a spatial resolution of 12.5 m from the ALOS PALSAR database were used to derive the slope length and steepness factor (LS-factor). Land-use types data were derived from Sentinel-2 imagery (10 m resolution, 2023) using supervised classification to generate the cropping and management factor (C-factor) and support practice factor (P-factor). All datasets were resampled to a uniform grid size and projected to the VN-2000 coordinate system before analysis.
2.3. Estimation of soil erosion
Soil erosion was quantified using the Revised Universal Soil Loss Equation (RUSLE) (Wischmeier & Smith, 1978).

Where:
- A represents the estimated mean annual soil loss (ton ha⁻¹ year⁻¹).
- R is the rainfall erosivity factor (MJ mm ha− 1 h− 1 yr− 1). It represents the potential of rainfall to cause soil erosion and is determined by the product of the total kinetic energy of rainfall and the maximum 30-minute rainfall intensity (Wischmeier & Smith, 1978). In this study, R is estimated using the formula proposed by Ha (1996) as follows:

Where: P is the yearly precipitation (mm) and interpolated using the Inverse Distance Weighting (IDW) method to compute the rainfall erosivity (R-factor).
- K is the soil erodibility factor (ton ha⁻¹ R unit⁻¹). It reflects the influence of soil properties and soil profile characteristics on soil loss and is estimated using the formula proposed by (Wischmeier & Smith, 1978) as follows:

Where: is the textural parameter calculated from the percentages of silt, very fine sand, and clay (M = (%very fine sand + %silt) × (100 - %clay)); is the soil organic matter content (%); is the soil structure code; and is the permeability class.
- LS represents the topographic factors, combining slope length and slope steepness (Panagos et al., 2015). It can be calculated from DEM and GIS tools (Cam, 2011; Panagos et al., 2015) according to the following formula:

Where: FlowAccumulation is calculated according to the flow direction; Cellsize is the size of the pixels; Slope is the slope of the terrain, measured in degrees.
- is the cropping and management factor (dimensionless). NDVI-based calculation of the C-factor is a well-established method in soil loss modeling (Durigon et al., 2014; Folharini & de Avila, 2022; Tsai et al., 2021). The C-factor ranges from 0 to 1, with 1 corresponding to bare soil and values near 0 representing well-protected, densely vegetated areas (Pham et al., 2018). In this study, the C-factor is determined based on the formula by (De Jong, 1994) and is appropriately adjusted for the study area using the following equation:

Where: R is the reflectance of ground objects in the red wavelength (%), and NIR is the reflectance of ground objects in the near-infrared wavelength (%).
- is the support practice factor (dimensionless) and is determined based on the P-table of Wischmeier & Smith (1978) (Table 1).
|
Table 1. P-factor lookup. |
||
|
Slope (%) |
P-factor |
Maximum slope length (m) |
|
1- 2 |
0.6 |
122 |
|
3 - 5 |
0.5 |
91 |
|
6 - 8 |
0.5 |
61 |
|
9 - 12 |
0.6 |
37 |
|
13 -16 |
0.7 |
24 |
|
17 - 20 |
0.8 |
18 |
|
21 - 25 |
0.9 |
15 |
|
Source: Wischmeier & Smith (1978) |
||
Each factor was spatially mapped in GIS, and the resulting raster layers were multiplied to produce a map of soil erosion intensity. According to the Ministry of Science and Technology Vietnam (2009), the erosion rates were categorized into five classes: very low (<5 ton ha⁻¹ year⁻¹), low (1-5), medium (5-10), high (10-50), and very high (>50).
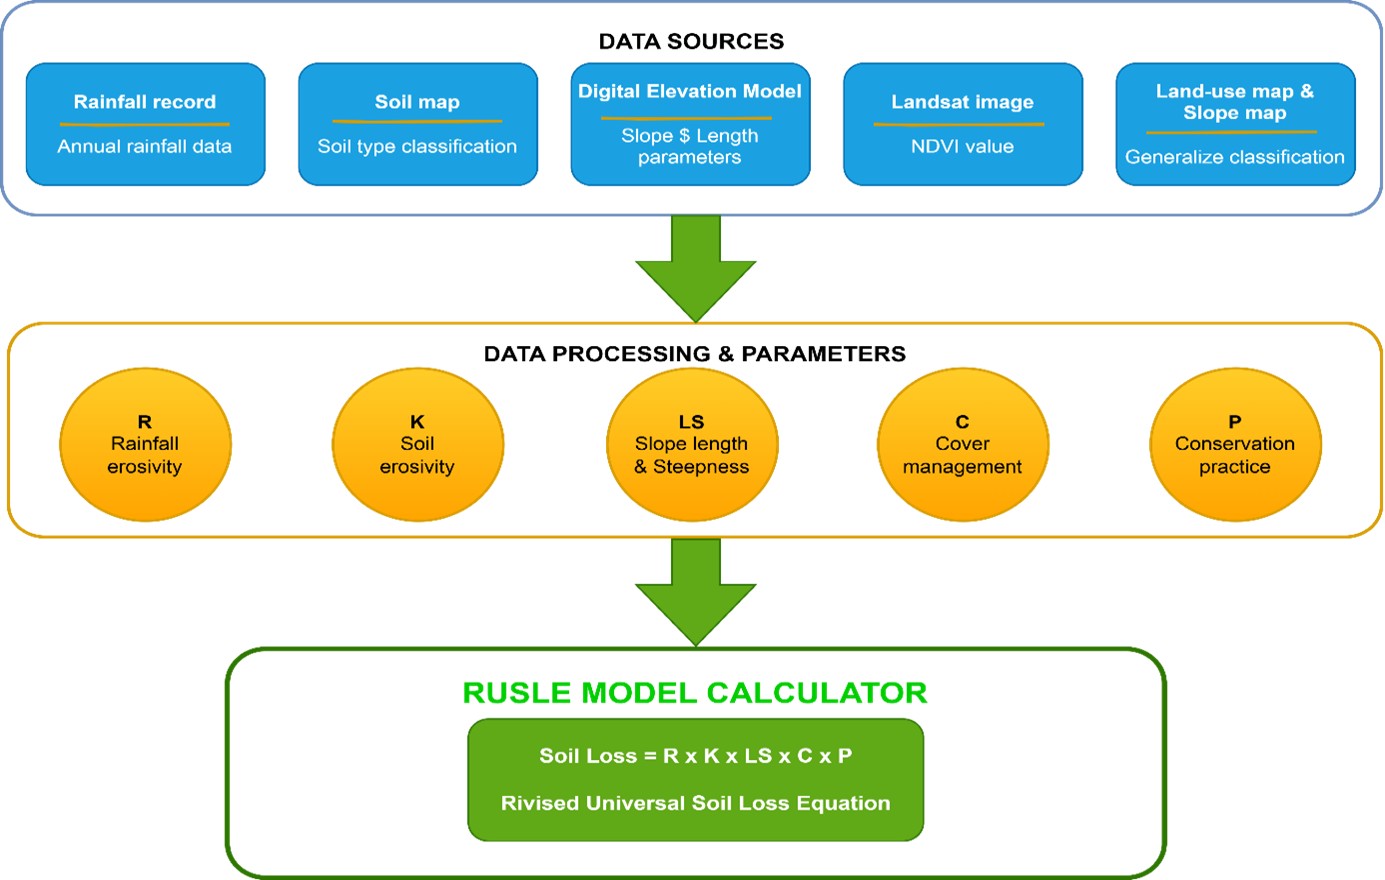
Flowchart of the research framework for soil erosion is presented in Figure 2.
2.4 Experimental setup and determination of nutrient loss
A plot-scale experiment was set up in the field in the three communes of Dinh Hoa District (Son Phu, Binh Thanh, and Diem Mac) to validate model-derived soil erosion estimates. These locations were chosen for their representativeness of the landform, climate, and major land-use types on sloping land. Three land-use models were investigated: production forest of 7-year-old acacia on slopes greater than 15°; tea plantation on slopes less than 8°; and cinnamon plantation on slopes greater than 10°. For each land-use model, three representative plots were chosen to ensure the reliability of the data. Soil erosion monitoring plots were established at the sites in a completely randomized design. The plots had an area of 50 m² (10m × 5m), with the long side running parallel to the slope. Earthen bunds (20-30 cm high) were raised around the plots to separate the runoff and a trench for collecting sediment (5m × 1m × 0.5m) was installed at the lower end of the bund lined with waterproof plastic, which served to capture runoff and sediment laden soil. Cultivation was done in the plots according to local custom and was documented during the period of monitoring. Trials were performed in the wet season from May to September, 2024.
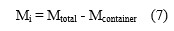
Eroded soil was periodically collected from the trenches, air-dried for 5-7 days, and weighed using a calibrated mechanical scale. The soil mass collected in each sampling event was calculated as:
The annual soil loss, standardized to one hectare, was calculated using the following equation:
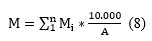
Where: M is the annual soil loss (kg/ha/year), M_i is the mass of soil collected in sampling event i, and A is the plot area (m²).
2.5. Statistical analysis
To investigate the correlation between soil erosion, slope gradient, and land-use types in the Song Cong basin, a uniform spatial grid was generated in the study with a GIS platform (ArcGIS, QGIS). The grid size was determined based on the basin area and the expected number of observation points. With a target of around 5,000-6,000 points, cell size of 400 m × 400 m is appropriate. The grid generation process was (i) defining the basin boundary from the DEM with watershed tool, (ii) creating a grid that entirely covers the basin, (iii) sampling at the center of each cell, (iv) clipping off the points outside the basin boundary, and finally, (v) clipping off the points in water bodies (such as rivers, lakes, and ponds). Each point was given a unique ID and visualized to evaluate data integrity and to confirm that the points sufficiently represented terrain features and land-cover classes. Slope gradient was derived from high-resolution DEM and grouped into three classes: gentle, moderate and steep, respectively, with the following slope value ranges in degree (gentle: <5, 5-8, and 8-10; moderate: 10-15, and 15-25; and steep: 25-35, 35-45, 45-55, and>55). Land-use classes were obtained from the classified Sentinel-2/Landsat and ground truthing with ten classes (production forest, non-agricultural land, paddy, perennial crops, other annual crops, special-use forest, protection forest, aquaculture, fallow land, and other agricultural land). The final dataset consisted of one dependent variable (soil erosion) and two independent variables (slope gradient and land-use type).
A two-way ANOVA was conducted in SPSS 26.0, followed by computation of effect size (Eta²) to assess the relative importance of each factor. The ANOVA model was specified as follows:

Where: Y_ijk is the soil erosion, A_i represents land-use types, B_j represents slope gradient, and (A*B)_ij is the interaction term between A and B. The significance threshold was p< 0.05.
A heatmap was then generated to show the interaction between slope classes and land-use types.
3. RESULTS
3.1. Assessment of soil erosion in the Song Cong basin
3.1.1. Development database for Revised Universal Soil Loss Equation
Figure 3 presents the spatial distribution of the five RUSLE factors, including rainfall erosivity factor (R), soil erodibility factor (K), topographic factor (LS), cropping and management factor (C), and support practice factor (P).
Rainfall erosivity factor (R): The rainfall erosivity factor ranges from 657.29 to 748.96 MJ mm ha− 1 h− 1 yr− 1 and is predominantly concentrated in the rainy season from May to September. Its spatial pattern clearly reflects how soil erosion is affected by topography, slope and vegetation cover. R values are low in the north and northeast (657 - 700 MJ mm ha− 1 h− 1 yr− 1) due to gentle slopes and denser vegetation cover, and high in the south and southwest (730 - 748 MJ.mm/(ha.hr.year)) due to mountainous terrain, steep slopes and sparse vegetative cover. The central part falls into the medium R category (700-730 MJ.mm/(ha.hr.year)) as it is situated between the mountains and plains. Variation in R also exists at the level of administrative units. Dai Tu District accounts for the high-R group area (MJ.mm/(ha.hr.year)), which occupies the largest proportion of 46.26%, while Dinh Hoa District experiences the lowest R values (657.29 - 680.21 MJ mm ha− 1 h− 1 yr− 1) with the largest share of 63.86%. A significant proportion of high R areas are concentrated in Pho Yen, Song Cong, and Thai Nguyen cities, allowing us to conclude that both urban and upland areas are at risk for significant erosion. Ultimately, the spatial variation of R is not merely a reflection of natural environment, but also represents a diversified erosion risk status for distinct areas of the basin.
Soil erodibility factor (K): The K factor was derived from the soil-map of Thai Nguyen Province and some related resources, with values varying from 0.14 to 0.50. Among the considered soil types, Dystric Gleysols have the highest K values, indicating that their weak structure, low stability and poor cohesion make this soil highly erodible. Conversely, Xanthic Ferralsols and Rhodic Ferralsols have relatively low K values, implying greater resistance against erosion due to their stable structure, high clay contents and adequate organic matter contents. Consequently, the K-factor spatial pattern clearly reveals the potential erosion across the basin, which serves as critical input for soil erosion modeling and soil conservation planning under sustainable land management and land use.
Cropping and management factor (C): The results show that the areas with low C values (< 0.2) are mostly situated in natural forests and plantations, where dense vegetation cover helps reduce surface runoff and limit soil erosion. Conversely, the high C value areas (> 0.6) cluster in urban and bare lands, suggesting diminished ground cover and heightened erosion risk as a result of farming and building activities. Areas with medium C values (0.2 - 0.6) are typically cropland or agroforestry, representing a medium level of soil protection. The differences in the C factor emphasize the importance of surface cover on soil erosion. Increasing vegetation cover, canopy areas and sustainable farming in the high-C areas are vital to mitigating the risk of erosion and conserving soil resources in the watershed.
Support practice factor (P): P values range from 0.003 to 1.00, suggesting distinct separation by land-use types and topography. Small values of P (< 0.2), which represent about 54% of the total area, are located in natural and protection forests in high slope areas , where thick vegetation cover plays a major role in attenuating surface runoff and containing soil loss. Conversely , high P values (0.6-1.0) are found in the plains and farmland, especially rice paddies, annual crops, and other productive lands, where frequent cultivation compromises the soil's protective function. The distribution of the P factor shows a clear dependence on elevation, land use, and anthropogenic influence. Regions of high P should be targeted for the application of best management practices (BMPs, i.e., contour tillage, cover cropping, agroforestry) to minimize soil loss and maintain watershed ecological integrity.

3.1.2. Assessment of soil erosion using GIS tools
The spatial distribution and magnitude of soil erosion over the entire study area associated with R, K, LS, C, and P parameter were precisely evaluated and mapped by considering the spatial layers of these parameters within the ArcGIS environment (Figure 4). In the figure, soil erosion in the Song Cong basin is shown, non-erosion (dark green) occurred in the flat land, low/ moderate erosion (light green to yellow) occurred in the gentle slopes, and severe erosion (red) was occurred in the steep slopes with scanty covering of the vegetation. The water is represented in light blue.

The research results demonstrates that the entire watershed is dominated by low-level soil erosion, representing effect of vegetation cover and gentle slopes over most sections of the watershed (Table 2). As shown in Table 2, non-eroded land occupies a large area of 56,951.33 ha, , representing 66.62% of the total area of the study site. These are places with either good vegetation coverage or flat land, so they are not as easily influenced by surface runoff. It is a stable region for agriculture as well as for protection. The area of mild erosion accounted for the 20,759.06 ha, which is 24.28% of the total. These areas tend to have mild slopes, insufficient vegetation cover, or are subjected to poor farming practices. These areas require appropriate land use management such as covering the soil with crops or farming across the slopes. The area affected by moderate erosion is 6,614.79 ha, which is 7.74 % of the total area. These areas are generally characterized by gentler terrain and denser vegetation cover. More rigorous soil conservation measures are required in this area, e.g. terracing or improving drainage systems. Severe erosion affects only 1,162.31 ha (1.36%) on high slopes with very little or no vegetation. These sites in particular need to be conserved using contour farming, terracing, planting vegetative buffer strips, or windbreaks. The erosion intensity in the Song Cong basin varies significantly with topography and land use management at different administrative levels.
|
Table 2. Result of soil erosion in Song Cong basin. |
||
|
Erosion level |
Area (ha) |
Percentage of total area (%) |
|
Very low |
56,951.33 |
66.62 |
|
Low |
20,759.06 |
24.28 |
|
Medium |
6,614.79 |
7.74 |
|
Severe |
1,162.31 |
1.36 |
|
Total |
85,487.49 |
100.00 |
Figure 5 shows the distribution of soil erosion levels at the administrative units within the Song Cong basin. In general, the no erosion area dominates in every unit, and especially in Song Cong (88.16%) and Thai Nguyen (84.82%), showing a good vegetation coverage and that the slope of the land is not too steep. On the other hand, Dai Tu district ranks highest in both moderate and severe erosion (29.14% and 11.18% respectively), indicating that it is the most vulnerable due to the steep terrain and the heaviest land use in the region. Based on the pattern, Pho Yen, Thai Nguyen and Song Cong, which are all lowland areas, have stable soil, but Dai Tu, a western upland district, has vulnerable soil.

These geographical variations demonstrate how important land cover and terrain gradient are in regulating soil erosion processes, indicating that steep slopes and little vegetation significantly raise the danger of erosion throughout the basin.
Table 3 presents a comparison of RUSLE predictions with observed data, indicating good agreement between the two methods. For tea, RUSLE gave an estimate of 0.65 t/ha/year and the field measurements 1.83 t/ha/year (a deviation of 21.70%), with both belonging to Erosion Class I. The RUSLE estimates for production forest and cinnamon land were 2.95 and 2.18 t/ha/year, respectively, and the field data were 3.62 and 2.69 t/ha/year (percent differences varying from 18.50 to 19.00%), both estimates falling into Erosion Class II. The differences between these two approaches are largely due to the following three reasons: (i) RUSLE uses spatially averaged C and P values while field measurements and observations are on site-specific points; (ii) spatial scales differ (30 m pixels for RUSLE versus 50 m2 plots for field measurement); and (iii) temporal scales differ (multi-year climatic averages for RUSLE versus field observations from the 2024 rainy season).
|
Table 3. Quantitative comparison between RUSLE estimates and field measurements. |
||||
|
Land use model |
Tea |
Forest |
Cinnamon |
Avg. |
|
RUSLE (t/ha/year) |
0.65 |
2.95 |
2.18 |
1.93 |
|
Field meas. (t/ha/year) |
0.83 |
3.62 |
2.69 |
2.38 |
|
Abs. diff. (t/ha/year) |
0.18 |
0.67 |
0.51 |
0.45 |
|
Rel. diff. (%) |
21.70 |
18.50 |
19.00 |
19.7 |
|
Erosion class (RUSLE) |
Class I |
Class II |
Class II |
- |
|
Erosion class (Field) |
Class I |
Class II |
Class II |
- |
|
Agreement |
✓ |
✓ |
✓ |
100% |
The research results confirm that the spatially distributed R (rainfall erosivity), K (soil erodibility), LS (topographic factor), C (cropping management), and P (support practice) factors within the ArcGIS environment not only provide a reliable estimation of the pattern of soil erosion over the Song Cong basin, but also reveal the spatial patterns of the intensity of erosion. As a result of the analyses of these layers, the land can be classified into severe, medium, low and very low erosion risk zones which can be used as a scientific input for land use planning and for implementing of soil erosion control measures. In addition, the integration of R, K, LS, C, and P factors into the GIS allows for evaluating the relationships among topography, soil type, and vegetation cover, which elucidate the processes of erosion formation and anticipate patterns of erosion in response to environmental or anthropogenic changes.
3.2. Assessment of slope gradient and land-use types in the Song Cong basin
3.2.1. Assessment of slope gradient
The results shown in Table 4 reveal that the Song Cong basin is mainly dominated by flat to gently undulating terrain, and the low-slope class (<10°) occupies 56.7% of the total basin. Among these, the less than 5° slope class occupies the highest percentage (28.1%), followed by the 5-8° category (18.6%) and 8-10° class (10.0%). This suggests that the majority of basin, in particular the middle and lower parts, has a fairly flat topography, which is conducive to urban, industrial and well-balanced agricultural development. The medium slope class (10-25) covers 27.9% of the area and is found predominantly on midland and low hill slopes where perennial crops or agroforestry are grown. It is a transitional terrain between the lowland terrain of the lower basin and the mountainous terrain of the upper basin and has moderate soil erosion risk, particularly under the influence of vegetation cover loss or improper land management.
High slope areas (>25°) represent 15.4% of the total area and the portions with slopes exceeding 35° represent only a very small fraction (6.5%) but are important in dealing with environmental risk. These areas are generally found in the west and northwest of the basin near the Tam Dao mountain range, where the land is rugged, slopes are steep and there is a likelihood of heavy erosion and landslides during strong rain or farming on sloped land. Therefore, the low sloped land greatly prevails, imposing a positive influence on socio-economic development, but approximately 43.3% of the rest with medium-to-high slopes should receive much more attention in soil management, land use planning, and land conservation. Slope dependent terrain classification allows the map user to determine susceptible areas, facilitate the use of topographic data in erosion models, and make to recommendations.
3.2.2. Assessment land-use types
The results in Table 5 illustrate the closeness among the land- use types that reflect the nature of a basin area where land use was mixed between agriculture and forest in the Song Cong basin. Production forest land makes up 19.58% (16,738.61 ha) of the total, followed by non-agricultural land at 16,600.43 ha (19.42%). Among agricultural land, land for rice cultivation and perennial crops accounts for a significant proportion, at 15.47% and 14.76% respectively, which confirms the leading role of agricultural production in the livelihoods of people in the basin area.
|
Table 4. Slope status in the SongCong Basin. |
|||
|
Slop class |
Slope range |
No. of points |
% of slope range |
|
Gentle |
<50 |
1,423 |
28.1 |
|
50-80 |
941 |
18.6 |
|
|
80-100 |
507 |
10.0 |
|
|
Moderate |
100-150 |
623 |
12.3 |
|
150-250 |
789 |
15.6 |
|
|
Steep |
250-350 |
445 |
8.8 |
|
350-450 |
234 |
4.6 |
|
|
450-550 |
78 |
1.5 |
|
|
>550 |
22 |
0.4 |
|
|
Total |
5,062 |
|
|
Paddy is found in almost all the cities and districts of the Song Cong basin; the largest area belongs to Dai Tu district, with 5,480.08 ha, while the smallest is in Thai Nguyen city, with a mere 685.16 ha. Tea plantation is a special type of perennial crop land use in the Song Cong basin and is widely found among many localities. Dai Tu district is also the largest cultivation area for tea with 9,442.85 hectares, mostly located in the lowland hills along with favorable climate and feralit soil. Although Thai Nguyen city has a smaller area of tea cultivation (about 859.01 ha), it is also a center for processing and consumption of tea as well as for developing the brand of Thai Nguyen tea, a signature agricultural product with high economic value and prestige both in the domestic and international markets. With traditional advantages, cultivation experience and tea value chain, this place is the core area of development for the tea industry across the entire basin. Besides this, there is also a contribution from other annual crop land (8.73%) and special use forest land (7.57%) in sustaining the biodiversity and ecological well being of the locality. Protection forest land and aquaculture land show modest proportions, at 6.14% and 5.49%, respectively. The proportion of unused land is only 2.15%, indicating underdevelopment of land resources.
|
Table 5. Land-use types in Song Cong basin. |
|||
|
Land-use types |
No. of points |
Area (ha) |
% of total area |
|
Production forest |
991 |
16,738.61 |
19.58 |
|
Non-agri. land |
983 |
16,600.43 |
19.42 |
|
Paddy |
783 |
13,268.93 |
15.47 |
|
Perennial crop |
747 |
12,609.03 |
14.76 |
|
Other annual crop |
442 |
7,434.04 |
8.73 |
|
Special-use forest |
383 |
6,466.74 |
7.57 |
|
Protection forest |
311 |
5,248.09 |
6.14 |
|
Aquaculture |
278 |
4,692.34 |
5.49 |
|
Unused land |
109 |
1,838.48 |
2.15 |
|
Other agri land |
35 |
590.80 |
0.69 |
|
Total |
5,062 |
85,487.49 |
100.00 |
The analysis results indicate that the structure of land use in the Song Cong basin was dominated by agricultural and forestry land, which reflects the production features of the midland and mountainous areas. It calls for integrated land use planning and land use management that can balance economic development, ecological environmental protection, and sustainable land resource management in the basin.
3.3. Assessment of the relationship between soil erosion, slope gradient, and land-use types in the Song Cong basin
Results in Table 6 demonstrated that although terrain slope had an increasing effect on soil erosion across all land-use types, a positive and strong correlation between topographic characteristics and soil erosion was also observed in the Song Cong basin. Under low slopes, the erosion intensity is at a low level (from 1.398 ± 0.492 to 1.497 ± 0.541), which can be attributed to the role of a flat surface combined with a thick vegetation canopy in reducing surface runoff and leaching. At a moderate slope level, erosion begins to increase rapidly, especially on forest land (1.996 ± 0.850) and non- agricultural land (1.720 ± 0.706). This could be attributed to the decrease in forest cover density on medium slopes as a result of deforestation and the expansion of production land, leaving the soil more exposed to intense rainfall. This is a common scenario in the hilly communes of Dai Tu and Phu Luong districts. Moreover , in those steep slope areas, the magnitude of erosion is abruptly increased , particularly on forest land (2.890 ± 0.916) and on other lands (2.900 ± 0.994). This implies that, in terms of erosion, slope can be considered a dominant factor in the watershed. The protective forest located in the upper highland areas, such as in Phuc Tan Commune of Pho Yen District or in the western highland of Dai Tu, for example, has a thin layer of soil, a low rate of infiltration, and the protective forest can hardly prevent the soil from being washed away by the rain, which falls in heavy pours throughout the days. The erosion susceptibility trend for agricultural soil catena is increasing from 1.424 ± 0.494 (low slope) to 2.587 ± 0.792 (high slope), reflecting the high vulnerability of cultivated soil on sloped terrain. In the tea-producing areas of Dai Tu, Phu Luong, or Dinh Hoa, growing tea on slopes without soil conservation measures (such as intercropping, grass strips, or terraces) has contributed to soil loss by accelerating rates of topsoil erosion and the diminution of agricultural topsoil.
|
Table 6. Average erosion by slope and land-use types. |
||||
|
Slop class |
Forest land |
Agri. land |
Non-agri. land |
Other land |
|
Gentle |
1.497 ± 0.541 |
1.424 ± 0.494 |
1.420 ± 0.502 |
1.398 ± 0.492 |
|
Moderate |
1.996 ± 0.850 |
1.672 ± 0.676 |
1.720 ± 0.706 |
1.522 ± 0.547 |
|
Steep |
2.890 ± 0.916 |
2.587 ± 0.792 |
2.544 ± 0.941 |
2.900 ± 0.994 |
The results of the present study in the Song Cong basin indicate that terrain slope is the most critical terrain parameter controlling the spatial distribution of the erosion index, and imply that land management practices should be slope-specific, particularly for agricultural land and protective forests, in order to reduce soil erosion and sustain soil resources.
The two-way ANOVA results (Table 7) indicate that the land-use types (A) and slope gradient (B) have significant influences on soil erosion. Of these, the slope factor has the most pronounced effect with F = 1,294.12 and η²=0.472, which explains 47.2% of the variation in the dependent variable, implying the dominant role of topography in erosion processes. The land use type remained significant (F=36.52; p < 0.001; η² = 0.060), suggesting that differences in protection and resistance to erosion can also be found between the different land use categories. Although it is not as powerful as the effect of slope, this finding undeniably shows the importance of vegetation cover and cultivation methods in reducing soil loss. There is a significant interaction between land use type and slope (A × B) as well (F=10.41; p<0.001; η²=0.034), indicating that the influence of land use on erosion is dependent on particular topographic factors. That is, the protection efficiency for each land use type can differ at various slope levels. From the results of this study, it can be affirmed that slope is the main determining factor, while the type of land use and the interaction between the two factors play a supplementary regulatory role in the level of soil erosion in the watershed.
|
Table 7. The results of the two-way ANOVA. |
||||
|
Source |
LUTs (A) |
Slope (B) |
Int. (A×B) |
Error |
|
df |
9 |
2 |
18 |
5.032 |
|
SS |
156.78 |
1,234.56 |
89.34 |
2,399.87 |
|
MS |
17.420 |
617.280 |
4.960 |
0.477 |
|
F-value |
36.52 |
1,294.12 |
10.41 |
|
|
P-value |
< 0.001 |
< 0.001 |
< 0.001 |
|
|
Eta2 |
0.060 |
0.472 |
0.034 |
|
Figure 6 shows that the distribution between the soil erosion and terrain slope, along with land-use types, is very closely matched. The findings indicate that soil erosion increases with an increasing slope.
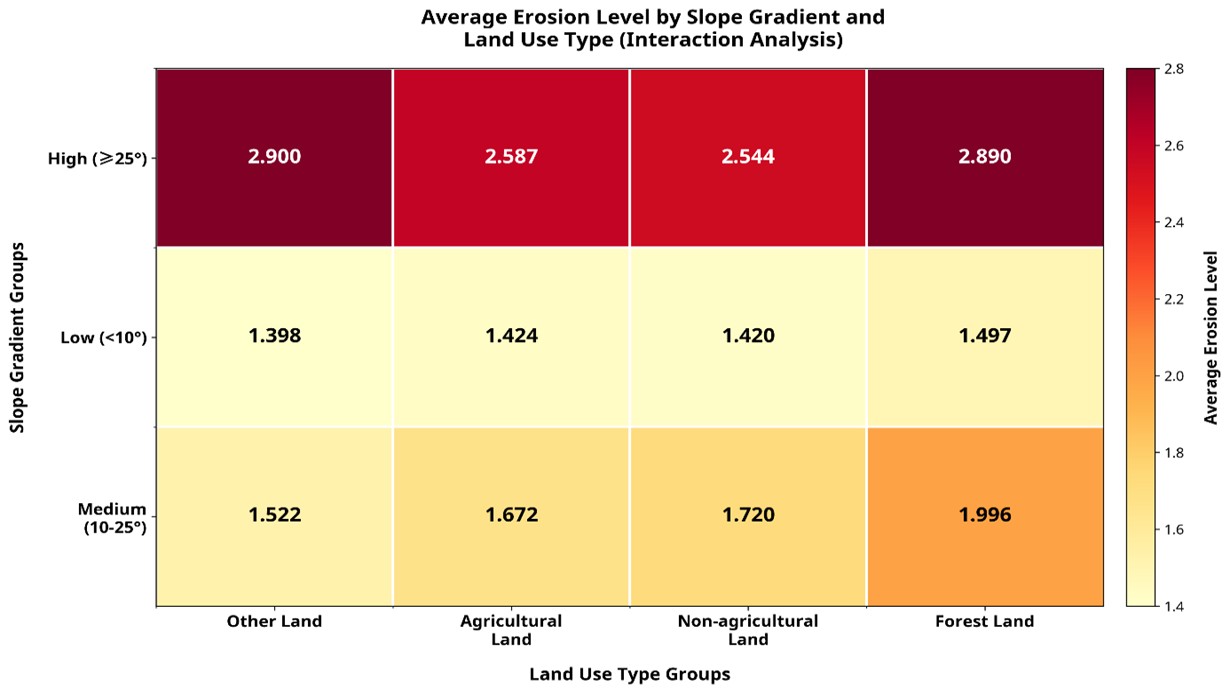
For example, for slopes greater than 25°, the mean erosion is very high for most soils, ranging from 2.5 to a little below 2.9 tons/ha/year. On the other hand, for slopes less than 10°, soil loss is about 1.4 tons/ha/year only which indicates a strong influence of topography on the erosion process. Land use types also differ significantly in slope influence. The highest rates of erosion occur in forest land in both medium and high slope classes, which means that the soil protection potential of forest cover is greatly reduced when forest cover decreases or when forest degrade, resulting in enhanced erosion. At the same time, cultivated land and non-agricultural land that are slanted also have high erosion amounts, perhaps because they did not take technical measures to firm the soil surface and control the rainwater flow on surface. These results confirm that predictions of soil erosion should be made by involving topographical features and land cover types together. Using land space efficiently, along with the implementation of proper soil conservation and reclamation techniques in mountain areas, is the key to stemming land degradation and sustainably safeguarding the soil resources.
4. DISSCUSSION
Based on the results of the above study, it can be seen that most of Song Cong basin is under very low to low erosion with 90.9% of the total area, indicating that the natural condition is relatively good, with flat topography and a stable land use level. This finding is consistent with prior studies, which shows that vegetation cover and gentle slopes are important factors for stabilizing and limiting soil erosion (Renard et al., 1997; Wischmeier & Smith, 1978). High runoff production and low resistance to detachment are commonly observed in sparsely vegetated and sloping areas, a tendency also reported in mountainous and monsoonal-influenced catchments (Morgan, 2005; Pham et al., 2018). About 9% of the territory, predominantly in areas of steep slopes or deteriorated vegetation, is still subject to moderate or high erosion. This finding aligns with prior studies conducted in Vietnam and confirms that soil erosion results from the interaction of several natural and human-induced factors with topography including slope, slope length, slope aspect, and landform is among the most critical factors, as it directly influences the velocity and area of soil erosion (Cam, 2011; Chinh, 2021; Hien & Vinh, 2017; My, 1995; C. Q. Nguyen et al., 2023). Consistent with this viewpoint, Pham et al., (2018) also emphasized that among the factors considered, topography was identified as the most influential driver of soil erosion, while support practices, soil erodibility, cropping management, and rainfall erosivity exerted comparatively lower but still significant effects.
It can be seen from Table 6 that slope is the most influential factor affecting erosion for all land use types and it exhibited a noticeable positive effect. The low rate of erosion on gentle slopes is due to a combination of topography and high vegetation cover there is less surface runoff and soil erosion. Conversely, erosion rises exponentially on moderate to steep slopes, primarily on forest land and non-agricultural land, as the forest cover diminishes and soil is left bare, which accelerates the soil detachment process. The results highlight the need for soil management to be slope-specific, especially for agricultural land and a further studies on protected forests and provision of additional protection for such forests should be the priority focusing on the slope aspect. The results align with previous studies, thus validating the importance of slope as a major control of soil loss (Derakhshan-Babaei et al., 2021; Ha et al., 2015; Khoa et al., 2001; Renard et al., 1997; Wischmeier & Smith, 1978). Experimental and review studies confirm that erosion increases with slope due to rising flow rate and surface flow velocity, resulting in more material being transported (Fox & Bryan, 2000). Panagos et al., (2015) highlight that in mountainous regions slope causes erosion intensity to change nonlinearly. Furthermore, several recent works emphasize the interaction between topography and land-use types. In the Loess Plateau (China), Jiao et al., (2022) reported that on slopes, unsuitable land use types caused a dramatic increase in erosion; conversely, studies in the dry valleys of Southwest China, Li et al., (2025) showed that land-use types and terrain attributes, primarily slope, led to significant variations in soil erosion resistance. These results support the notion that slope is the dominant factor and land use is a regulating factor, especially in steep terrain regions.
Two-way ANOVA mean comparison (Table 7) indicates that both slope (B) and type of land use (A) have a significant effect (p < 0.001) on the intensity of erosion. Of the two factors, the slope is the dominant factor with F = 1,294.12 and η² = 0.472, which accounted for 47.2% of the total variance, indicating that topographic characteristics have decisive influence on erosion process. Land use type also has a significant impact (F = 36.52; η² = 0.060), highlighting the influence of vegetation cover and management systems on controlling soil erosion. There is a statistically significant two factor interaction (A×B) (F = 10.41; η² = 0.034), which means the soil protection capacity of each land use type is strongly dependent on topographic conditions. These findings are in line with previously reported studies that suggest erosion increases exponentially with slope, particularly in areas suffering from degraded or patchy cover (Panagos et al., 2015; Zhao et al., 2013). Meanwhile, the contrasts between land use categories confirm the dominant influence of vegetation cover, as in the case of (Nguyen et al., 2025), who noted a strong correlation between cover rate and level of erosion. Statistically significant interactions between factors also inform us that the effectiveness of a land use type in controlling erosion may vary within slope levels, suggesting that the measures for land management should be tailored to the specific combination of terrain and land use types for the best protection results (Jiao et al., 2022; Li et al., 2025).
The ANOVA and heat map analyses clearly indicate that forest soils on medium and steep slopes are most eroded when ground cover is diminished or the forest is disturbed. This agrees with earlier studies that have shown that the erosion power is stronger in degraded forests or with minimal vegetation cover whereas the soil is well protected under natural forest vegetation (Panagos et al., 2015; Zhao et al., 2013). Agricultural and non-agricultural soils on hillsides are also at risk in the absence of flow-regulating structures, but the degree of erosion is not as severe as that of degraded forest. This corresponds to the observations of Borrelli et al., (2017), who showed that agricultural soil accounts for little of the total area and is under relatively high erosion, while forests occupy a larger portion of the area but are generally under low erosion. These results highlight that evaluation and prediction of erosion should consider topography, land use types, and vegetative cover, and confirm the importance of forest conservation and the appropriate management of agricultural land as the measures to reduce soil degradation and surface erosion.
5. CONCLUSION
The results indicate that very low to low erosion dominates the basin with a proportion of 90.9%, followed by about 9% of the area is occupied by moderate to severe erosion, widely distributed on slopes or degraded natural forest. Two-way ANOVA results revealed that land use type and slope had a significant effect on erosion intensity (p < 0.001) wtth slope having the highest influence factor, accounting for 47.2% of the variation, whereas land use type was considered to have a regulatory effect, explaining 6% of the variation. Furthermore, the interaction between slope and land use type is also significant, indicating the degree of erosion control for each land type could vary with different terrain types. In particular, forest soil on medium and steep slopes is rill- and interrill-eroded as severely as it can be under decreasing cover, while cropland and rangeland soil on slopes is subject to erosion, but to a lesser extent, which indicates that erosion is distinctly related to both land-use types and terrain characteristics. These suggest that land management and land use policy should be aimed at conserving the natural vegetation, particularly in slope areas, and at developing suitable agricultural practices and soil management measures for each slope to mitigate erosion and land degradation for sustainable basin development.
Acknowledgments
We sincerely thank Thai Nguyen University of Agriculture and Forestry and the local authorities for their invaluable support and assistance throughout this study.
We sincerely thank the Department of Natural Resources and Environment of Thai Nguyen Province and the People’s Committees of the cities and districts (Thai Nguyen, Song Cong, Pho Yen, Dinh Hoa, Dai Tu) for their invaluable support in providing documents and data for this study.
We are particularly grateful to the local authorities of Son Phu, Binh Thanh, and Diem Mac communes, Dinh Hoa District, for their invaluable support during the implementation of the model and the assessment of soil erosion across different land-use types.
REFERENCES
- Ascencio-Sanchez, M., Padilla-Castro, C., Riveros-Lizana, C., Hermoza-Espezúa, R.M., Atalluz-Ganoza, D. & Solórzano-Acosta, R., 2025. Impacts of Land Use on Soil Erosion: RUSLE Analysis in a Sub-Basin of the Peruvian Amazon (2016-2022). Geosciences, 15(1), 15, https:// doi.org/10.3390/geosciences15010015.
- Au, N.T.T., 2016. Evaluating soil erosion by GIS and universal soil loss equation in Kon Tum province. Journal of Technical Education Science, 38, 78-85.
- Borrelli, P., Robinson, D.A., Fleischer, L.R., Lugato, E., Ballabio, C., Alewell, C., Meusburger, K., Modugno, S., Schütt, B., Ferro, V., Bagarello, V., Oost, K.V., Montanarella, L. & Panagos, P., 2017. An assessment of the global impact of 21st century land use change on soil erosion. Nature Communications, 8(1), 2013, https://doi.org/ 10.1038/s41467-017-02142-7.
- Borrelli, P., Robinson, D.A., Panagos, P., Lugato, E., Yang, J.E., Alewell, C., Wuepper, D., Montanarella, L. & Ballabio, C., 2020. Land use and climate change impacts on global soil erosion by water (2015-2070). Proceedings of the National Academy of Sciences, 117(36), 21994-22001, https://doi.org/10.1073/pnas.2001403117.
- Cam, L.V., 2011. Soil erosion study by using RUSLE model (A case study in Quang Tri province, Central Vietnam). VNU Journal of Science, Earth Sciences 27 (2011), 27, 191-198.
- Chinh, T.M., 2021. Research to determinate the quality model of soil erosion suitable for typical agricultural system on sloping land [Technical Doctoral Thesis of Water Resources Engineering]. Vietnam Academy for Water Resources.
- De Jong, S.M., 1994. Derivation of vegetative variables from a landsat tm image for modelling soil erosion. Earth Surface Processes and Landforms, 19(2), 165-178, https://doi.org/10.1002/esp.3290190207.
- Derakhshan-Babaei, F., Nosrati, K., Mirghaed, F.A. & Egli, M., 2021. The interrelation between landform, land-use, erosion and soil quality in the Kan catchment of the Tehran province, central Iran. CATENA, 204, 105412, https://doi.org/ 10.1016/j.catena.2021.105412.
- Dung, N.V. & Ky, N.D., 2012. Quantitive assessment soil erosion by USLE and GIS in mountains and hills, Thanh - Nghe - Tinh region. Vietnam Journal of Earth Sciences, 34(1), 31-37.
- Durigon, V.L., Carvalho, D.F., Antunes, M.A.H., Oliveira, P.T.S. & Fernandes, M.M., 2014. NDVI time series for monitoring RUSLE cover management factor in a tropical watershed. International Journal of Remote Sensing, 35(2), 441–453, https://doi.org/ 10.1080/01431161.2013.871081.
- Folharini, S. & de Avila, A.M.H., 2022. C-Factor Estimate for Soil Loss Equations Using Transformation Function (Near, Gaussian and Symmetric Linear) and Remote Sensing Data. Proceedings, 87(1), 24, https://doi.org/10.3390/ IECG2022-13747.
- Fox, D.M. & Bryan, R.B., 2000. The relationship of soil loss by interrill erosion to slope gradient. CATENA, 38(3), 211-222, https://doi.org/ 10.1016/S0341-8162(99)00072-7.
- Guerra, C.A., Rosa, I.M.D., Valentini, E., Wolf, F., Filipponi, F., Karger, D.N., Nguyen Xuan, A., Mathieu, J., Lavelle, P. & Eisenhauer, N., 2020. Global vulnerability of soil ecosystems to erosion. Landscape Ecology, 35(4), 823-842, https:// doi.org/10.1007/s10980-020-00984-z
- Ha, D.T., Thang, N.V. & Trung, L.V., 2015. Application of GIS and remote sensing to assess soil erosion in Thai Nguyen province. Vietnam Journal of Soil Science, 45, 45-52.
- Ha N.M., Dung N.V. & Ngoc H.H., 2013. Application of USLE and GIS tool to predict soil erosion potential and proposal land cover solutions to reduce soil loss in Tay Nguyen. Vietnam Journal of Earth Sciences, 35(4), 403–410, https://doi.org/ 10.15625/0866-7187/35/4/4126.
- Ha, N.T. 1996. Identify the factors effect to soil erosion and forecast soil erosion on slope land [Ph.D.Dissertation]. Water Resources University of Vietnam.
- Hien N.T.T. & Vinh T.Q., 2017. Constructing Map of Agricultural Soil Erosion Risk by Spatial Analysis Technique of GIS in Tam Nong District, Phu Tho Province. Vietnam Journal of Agricultural Science, 15(6), 796–807.
- Hoc, P.B., Viet, N.Q., Hung, P.A., Thai, L.X., Chinh, L.S. & Hai, N. X., 2019. Integrated Geographical Information System (GIS) and Remote Sensing for Soil Erosion Assessment by Using Universal Soil Loss Equation (USLE): Case Study in Son La Province. VNU Journal of Science: Earth and Environmental Sciences, 35(1), https://doi.org/ 10.25073/2588-1094/vnuees.4350.
- Huang, C., Yang, Q., Cao, X. & Li, Y., 2020. Assessment of the Soil Erosion Response to Land Use and Slope in the Loess Plateau-A Case Study of Jiuyuangou. Water, 12(2), 529, https://doi.org/ 10.3390/w12020529.
- Blanco, H. & Lal, R., 2008. Principles of Soil Conservation and Management (1st edition). Springer Nature.
- Jiao, L., Yang, W., Jia, T., Maierdang, K., Chen, W., Gao, G., Wang, S., Liu, J. & Wang, C., 2022. Effects of land use patterns on slope soil water in the semiarid Loess Plateau, China. Journal of Geographical Sciences, 32(4), 701-716, https:// doi.org/10.1007/s11442-022-1968-7.
- Khoa, L.V., Son, N.T. & Phuc, T.V., 2001. Assessment of soil erosion using the USLE model in some watersheds in Northern Vietnam. Journal of Science and Technology, 39(2), 78-85.
- Koulouri, M. & Giourga, Chr., 2007. Land abandonment and slope gradient as key factors of soil erosion in Mediterranean terraced lands. CATENA, 69(3), 274-281, https://doi.org/ 10.1016/j.catena.2006.07.001.
- Lal, S., 2017. Soil Erosion Research Methods (2nd ed.). Routledge, https://doi.org/10.1201/9780203739358.
- Li, J., Liu, S., Yang, D., Suo, F., Yu, Y., Wang, Z. & Liao, Q., 2025. The Impact of Land Use Types on the Soil Erosion Resistance in the Arid Valley Region of Southwest China. Agriculture, 15(4), 386, https://doi.org/10.3390/agriculture15040386.
- Luo, T., Liu, W., Xia, D., Xia, L., Guo, T., Ma, Y., Xu, W. & Hu, Y., 2022. Effects of land use types on soil erodibility in a small karst watershed in western Hubei. PeerJ, 10, e14423, https://doi.org/ 10.7717/peerj.14423.
- Mazure, T., Saulnier, G.-M., Giguet-Covex, C., Sabatier, P., Bajard, M., Chanudet, V., Arnaud, F. & Jenny, J.-P., 2024. Half of the soil erosion in the Alps during the Holocene is explained by transient erosion crises as a consequence of rapid human land clearing. The Holocene, 34(9), 1290–1303, https://doi.org/ 10.1177/09596836241254485.
- Ministry of Science and Technology Vietnam, 2009. Soil quality-Method for de- termination of soil erosion by rain. Hanoi, Vietnam: National Standard Document.
- Montanarella, L., Pennock, D. J., McKenzie, N., Badraoui, M., Chude, V., Baptista, I., Mamo, T., Yemefack, M., Singh Aulakh, M., Yagi, K., Young Hong, S., Vijarnsorn, P., Zhang, G.L., Arrouays, D., Black, H., Krasilnikov, P., Sobocká, J., Alegre, J., Henriquez, C. R., … Vargas, R. 2016. World’s soils are under threat. Soil, 2(1), 79-82, https://doi.org/10.5194/soil-2-79-2016.
- Morgan, R.P.C., 2005. Soil Erosion and Conservation (3rd ed.). Wiley.
- My, N.Q. 1995. The Influence of Topographic Factors on Soil Erosion in Vietnam. Ournal of Science, Vietnam National University, XI(1), 55-59.
- Nguyen, C.Q., Tran, T.T., Nguyen, T.T.T., Nguyen, T.H.T., Astarkhanova, T.S., Vu, L.V., Dau, K.T., Nguyen, H.N., Pham, G.H., Nguyen, D.D., Prakash, I. & Pham, B., 2023. Mapping of soil erosion susceptibility using advanced machine learning models at Nghe An, Vietnam. Journal of Hydroinformatics, 26(1), 72, https:// doi.org/10.2166/hydro.2023.327.
- Nguyen, T.T.N., Pham, M.P., Tong, T.H. & Hens, L., 2025. Evaluation of soil loss across land use types in Northern Vietnam, a case study of Tay Con Linh mountain. Journal of Science and Technique - Section on Special Construction Engineering, 8(01), https://doi.org/10.56651/lqdtu.jst.v8.n01.893.sce.
- Panagos, P., Borrelli, P., Poesen, J., Ballabio, C., Lugato, E., Meusburger, K., Montanarella, L. & Alewell, C., 2015. The new assessment of soil loss by water erosion in Europe. Environmental Science & Policy, 54, 438-447, https://doi.org/ 10.1016/j.envsci.2015.08.012.
- Pham, T.G., Degener, J. & Kappas, M., 2018. Integrated universal soil loss equation (USLE) and Geographical Information System (GIS) for soil erosion estimation in A Sap basin: Central Vietnam. International Soil and Water Conservation Research, 6(2), 99-110, https:// doi.org/10.1016/j.iswcr.2018.01.001.
- Renard, K.G., Foster, G.R., Weesies, G.A., McCool, D.K. & Yoder, D.C. 1997. Predicting Soil Erosion by Water A Guide to Conservation Planning with the Revised Universal Soil Loss Equation (RUSLE). Overnment Printing Office.
- Siem, N.T. & Phien, T., 1999. Upland soils in Vietnam-Degradation and restoration. Agriculture Publishing House.
- Tošić, R., Dragićević, S., Lovrić, N. & Langović, M., 2025. Mapping soil erosion intensity using Erosion Potential Method (EPM): Case study - Bosnia and Herzegovina. Carpathian Journal of Earth and Environmental Sciences, 20 (2), 413 - 426, Doi:10.26471/cjees/2025/020/343.
- Tsai, F., Lai, J.-S., Nguyen, K.A. & Chen, W., 2021. Determining Cover Management Factor with Remote Sensing and Spatial Analysis for Improving Long-Term Soil Loss Estimation in Watersheds. ISPRS International Journal of Geo-Information, 10(1), 19, https://doi.org/10.3390/ijgi10010019.
- Wei, W., Chen, L., Fu, B., Huang, Z., Wu, D. & Gui, L., 2007. The effect of land uses and rainfall regimes on runoff and soil erosion in the semi-arid loess hilly area, China. Journal of Hydrology, 335(3), 247-258, https://doi.org/ 10.1016/j.jhydrol.2006.11.016.
- Wischmeier, W.H. & Smith, D.D., 1978. Predicting Rainfall Erosion Losses. A Guide to Conservation Planning. USDA-ARS Handbook No. 537, United States Government.
- Zhao, G., Mu, X., Wen, Z., Wang, F. & Peng, G., 2013. Soil erosion, conservation, and Eco-environment changes in the Loess Plateau of China. Land Degradation & Development, 24, https:// doi.org/10.1002/ldr.2246.