1. INTRODUCTION
Floods represent one of the most significant natural hazards threatening urban areas, and urban floods are classified as major global natural disasters, causing approximately 20,000 fatalities each year (UNDRR & CRED, 2020), particularly in cities with weak infrastructure, due to their severe human and economic impacts. These challenges underscore the urgent need for sustainable urban planning and effective urban risk management strategies. Floods often result from intense and sudden rainfall that exceeds the capacity of drainage networks, rising levels of nearby rivers and wadis, or unregulated human activities such as construction along watercourses. Globally, both the frequency and intensity of urban floods have increased markedly in recent decades. Between 2000 and 2019, floods accounted for 44% of all disasters, affecting 1.6 billion people worldwide. The combined effects of climate change and rapid urbanization exacerbate the frequency and severity of these floods, exposing communities to hazards and causing disruptions in transportation, infrastructure damage, and property loss (Mekkaoui et al., 2025).
Cities in developing countries are particularly vulnerable to flood risks compared to those in developed nations, primarily due to inadequate stormwater and wadi (a seasonal river) drainage infrastructure, as well as urban planning patterns that often fail to integrate flood-prone areas within development strategies (Hemmati et al., 2020). The increasing intensity of extreme weather events has transformed urban floods into a direct threat to human safety, economic activity, environmental quality, and the stability of vulnerable populations (IPCC, 2022). Consequently, integrated approaches that combine urban planning, proactive city management strategies, and advanced digital technologies have become essential to mitigate escalating flood risks. Tools such as the Hydrologic Engineering Center’s River Analysis System (HEC-RAS 5.0.4) and Geographic Information Systems (GIS), particularly Arc Hydro, allow for detailed hydrological and hydraulic modeling, enabling the simulation of water depths, flow velocities, and flood-prone areas. These models support scenario analyses under conditions of future urban expansion or climate change (Zhang et al., 2023).
Geographic Information Systems facilitate the processing and analysis of topographic, hydrological, social, and economic data, enabling the identification of water flow networks, slope directions, and gradient levels. Such analyses constitute essential tools for supporting sustainable urban planning and producing accurate flood risk distribution maps (Meraj et al., 2019).
In Morocco, urban floods remain a persistent challenge, having intensified over recent decades due to unplanned urban expansion, particularly in low-lying areas near rivers and wadi channels (Satour et al., 2021). Historically, many settlements developed near watercourses to access water for domestic and agricultural purposes. The Lower Souss Valley, extending from the southern suburbs of Agadir to the north of Aït Melloul, exemplifies this type of flood-prone urban expansion. Recent floods in this area, resulting from heavy rainfall in the Souss River basin, highlight the combined impact of low-lying terrain, narrow river channels, and intense urban pressure on environmental and spatial vulnerability.
Despite current studies on urban flooding in Morocco, few have integrated high-resolution hydraulic modeling with Geographic Information Systems to assess urban-scale flood risks in North African contexts. This study addresses this gap by combining two-dimensional HEC-RAS (5.0.4) modeling with GIS-based spatial analysis to identify flood-prone neighborhoods in Agadir, providing insights that can enhance scientific understanding and inform practical flood risk management strategies in similar urban environments.
Moreover, this approach can contribute to improving the accuracy of flood volume, water depth, and flow velocity estimates, thereby enabling risk assessment for critical infrastructure such as roads, bridges, drainage networks, and public facilities. The integration of hydraulic modeling with spatial analysis also allows for examining the influence of topographic and cartographic factors on flood distribution, thereby supporting sustainable urban planning and evidence-based preventive decision-making. Additionally, these results can be used to develop flood hazard maps that assist policymakers and local authorities in implementing early warning strategies, prioritizing interventions and evacuations, and enhancing disaster management systems in Moroccan cities and other urban areas with similar geographical and hydrological conditions.

The Lower Souss Valley suffers from a structural issue in spatial planning, highlighting the urgent need to adopt proactive spatial management approaches that consider topographic and hydrological data. These approaches must rely on digital analytical tools such as HEC-RAS and GIS to minimize the impacts and recurring risks of floods.
This study seeks to address the following core research question: To what extent can digital analysis tools (HEC-RAS and GIS) identify flood-prone areas and contribute to spatial planning and management in urban areas, while proposing proactive approaches to mitigate flood risks?
The study proposed a set of scientific hypotheses that serve as an initial response to the central research question. It is assumed that urban zones situated in the lower Souss River basin - extending from the southern outskirts of Agadir to the northern limits of Aït Melloul - face significant flood exposure. This vulnerability is amplified by the expansion of construction over flood-prone lands adjacent to the river’s main channel. The area’s position along the southern bank of the Souss River, combined with intense urban pressure, makes it highly susceptible to the accumulation of surface runoff from nearby highlands, often resulting in flash floods that inundate streets, damage property, disrupt traffic, and hinder local economic activity.
Building on the previously formulated hypotheses, the theoretical framework establishes the scientific and methodological foundations for understanding floods from both hydrological and spatial perspectives. It draws on recent studies and modeling approaches that explain runoff dynamics and flood risks in urban environments.
Floods are extreme water flows that exceed river limits, causing severe damage to land, property, and human safety, particularly in urban areas where weak infrastructure and poor planning amplify risks (Khosrowpanah et al., 2019). Human activities such as unplanned urbanization in floodplains, lack of protective systems, and non-engineered interventions worsen flash floods and their impacts (Meraj et al., 2019). Globally, floods are among the most destructive natural disasters, with heavy human and material losses, especially when water flow surpasses channel capacity in vulnerable urban zones (Smith et al., 2023). Across Mediterranean regions, floods remain among the most frequent and damaging natural hazards, driven by intense rainfall patterns, rapid urban growth, and increased exposure of settlements in low-lying coastal and riverine zones (Tramblay et al., 2020).
In Mediterranean urban environments, hydraulic modelling frameworks like HEC-RAS provide not only hazard-assessment outputs but also essential evidence for climate-adaptation policies, enabling authorities to anticipate extreme flow scenarios, plan flood-resilient infrastructure, and strengthen early-warning and land-use decision-making capacities (United Nations Office for Disaster Risk Reduction, 2022.)
Morocco’s transitional climate, influenced by both westerlies and southeastern winds, creates irregular weather and heightens flood risk, emphasizing the importance of digital modeling for management. The HEC-RAS (5.0.4) model, widely used for hydrodynamic flood simulation, performs 1D/2D flow and sediment analyses based on geometric and hydraulic data (Dasallas et al., 2019). It can integrate with other tools for applications such as stormwater drainage, urban expansion assessment, dam design, and floodplain management (Scharffenberg & Fleming, 2010). This study applies HEC-RAS to analyze water depth, velocity, and surface elevation.
2. METHODOLOGY
This study is based on the use of HEC-RAS (5.0.4) and Geographic Information Systems (GIS). These modern digital tools are essential for analyzing and forecasting flood scenarios. HEC-RAS enables accurate simulation of surface runoff in the lower Souss River and surrounding areas, while GIS allows the integration of topographic, hydrological, and spatial data into a single digital environment. This integration facilitates the creation of flood risk maps and the development of proactive intervention plans. The study followed three main phases:

This study is based on a set of assumptions that may influence the precision of the hydraulic modeling results. A 30-meter resolution Digital Elevation Model (DEM) was employed as the primary topographic input. The choice of this DEM is justified by its wide availability as a free and standardized dataset commonly adopted in urban and hydrological studies. It offers a practical balance between spatial detail and computational efficiency, making it appropriate for the scale and geomorphological characteristics of the studied urban basin. However, the 30 m resolution may limit the accurate representation of small-scale topographic variations that could affect the simulation of surface runoff pathways, particularly in the lower reaches of the Souss River.
The land use and land cover (LULC) data were generated through a supervised classification approach based on representative training samples obtained from visual interpretation and field validation. This method was preferred over unsupervised techniques because it ensures higher thematic accuracy and greater control over class boundaries. The classification utilized Sentinel-2 multispectral imagery with a spatial resolution of 10 meters, which provides sufficient detail for urban and peri-urban environments. The resulting LULC map was verified through comparison with national land cover databases and recent high-resolution satellite imagery, ensuring a reliable spatial representation of land use patterns within the study area.
Infiltration and soil absorption processes were not directly simulated in the hydraulic modeling framework; instead, the influence of land use on surface hydrology was indirectly incorporated through the classified LULC data derived from Sentinel-2 and complementary Landsat 8 imagery processed in ArcGIS 10.01. Regarding precipitation inputs, rainfall data were obtained from official meteorological stations (Agadir and Aït Melloul) and supplemented with global CHIRPS-CHIRTS datasets (https://swat.tamu.edu/data/chirps-chirts/). While these sources provide continuous coverage, they may not fully capture the localized variability of extreme rainfall events.
The model calibration relied on available historical flood records in Agadir. Due to limited field measurements, full quantitative validation was not feasible. Nevertheless, the simulation outputs were qualitatively compared with well-documented flood occurrences over recent decades, ensuring a reasonable representation of flood-prone areas and supporting the reliability of the modeling framework.
3. RESULTS AND DISCUSSION
3.1. Geographical and Hydrological Environment of the Lower Souss Valley
The city of Agadir has a unique climatic profile, with cold, low-precipitation winters and hot, dry summers. The annual average rainfall is approximately 250 mm, a figure that continues to decrease due to ongoing climate change. However, some years have experienced intense rainfall leading to floods, as occurred in 1956, 1977, 1996, 2008, 2009, 2010, 2014, and 2025. Rainy days are typically concentrated between November and March (Berdgue, 2017).
Temperature ranges between 14–16°C in January and 20–25°C in July, with occasional hot desert winds known locally as “Chergui”, which can raise temperatures above 40°C during short periods lasting between two to five days (Berdgue, 2017).
From a topographical perspective, the study area shows a gradient in elevation from sea level(0 m) at the river mouth to around 135 meters in the northeastern section, indicating a relatively steep slope in that area.
Figure 3 reveals that the lower reach of the Souss River flows through a low-lying zone with elevations not exceeding 45 meters, confirming the predominantly flat nature of the study area and its location within a low-lying alluvial plain.

The hydrographic network in the study area shows a clear concentration of wadis in the northeastern part, where seasonal watercourses predominate (Figure 4). These wadis, which are particularly active during rainfall periods, serve as the main tributaries feeding the Souss River, which itself is characterized by a seasonal and intermittent flow regime. During periods of sudden and exceptional rainfall, the water levels in these wadis and streams rise rapidly, resulting in large volumes of water flowing towards the Souss River channel. This sudden increase in discharge exacerbates the flood risk, especially in the low-lying plain areas of the Lower Souss Valley, contributing to flash floods that can be highly destructive. These hydrological characteristics underscore the importance of continuous monitoring and hydraulic planning based on precise modeling of the behavior of seasonal watercourses, in order to mitigate the risks associated with flash floods.

3.2. Flood Chronology in the City of Agadir
Based on climatic data and archives from relevant authorities, particularly the Souss Massa Drâa River Basin Agency (ABHSMD), it is evident that the city of Agadir experienced several hydrological flood events between 1913 and 2014 (Berdgue, 2017). These floods were characterized by their intensity, resulting from exceptional and heavy thunderstorm rainfall. In general, six main flood periods can be identified, including three major and impactful floods:
· 1956 Floods, with a maximum instantaneous discharge of 1,040 cubic meters per second.
· 1977 Floods, with a maximum instantaneous discharge of 980 cubic meters per second.
· 1996 Floods, recording a maximum instantaneous discharge of 1,015 cubic meters per second.
· February 2010 Floods, considered the most severe, with discharge reaching 2,000 cubic meters per second, making them, according to official archives and eyewitness accounts, among the most violent floods in the city's recent history (Berdgue, 2017).
· Finally, the 2014 and 2025 Floods, which also caused significant damage.
3.3 Results Analysis and Flood Risk Assessment
After inputting the hydrographic and hydraulic data related to the Lower Souss Valley into the HEC-RAS (5.0.4) program, the geometric model of the study area was constructed by generating cross sections using the RAS Geometry tool. In this process, the centerline of the lower Souss River channel (Stream Centerline) was precisely digitized based on high-resolution satellite images to ensure a realistic representation of the natural river course, taking into account its meanders without intersecting topographic or man-made features.
The right and left bank lines (Bank Lines) were also digitized approximately parallel to the centerline to define the actual flow boundaries of the river channel. In the same context, FlowPath Lines were created adjacent to the bank lines, allowing the guidance of water movement within the river channel in the digital model. The geometric structure was further completed by creating XS Cutlines (cross-section cutlines) perpendicular to the centerline using the XSCutlines tool to extract detailed morphometric data related to the width, depth, and slope of the channels.
After completing all stages of preparing the geographic and hydrological structure, the model was exported to the HEC-RAS environment via the “Export to HEC-RAS” function, which enabled the initiation of hydraulic simulations. This procedure allowed for representing the flow behavior in the Lower Souss Valley and identifying the areas most vulnerable to flooding based on topographic distribution and slopes.
3.3.1. Cross Sections
Before presenting the flood study results for the Lower Souss Valley using the HEC-RAS model, a series of regular cross sections along the river course were adopted (as illustrated in Figure 5), extending from the mouth at the Atlantic Ocean in the west to the inland areas in the east.
The cross-section data define the geometric boundaries of the river channel. Accurate representation of the river channel and the adjacent floodplain is essential for creating a precise hydraulic model (HEC-RAS User's Manual, 2023).

It is noticeable from the distribution shown in Figure 5hat the density of cross sections increases in the urban areas at the center of the study area. This is necessary to improve the quality of results, especially in densely populated zones and areas with complex urban structures, while the density decreases in the natural and agricultural areas predominant at the periphery. The data also show that some cross sections pass through densely urbanized zones, which increases the potential risk in the event of severe flooding, particularly where infrastructures such as roads and bridges may obstruct or alter the natural flow path.
On the other hand, the cross sections located in agricultural areas serve as natural flood expansion zones, helping to reduce flow velocity and intensity. Therefore, the accuracy, spatial distribution, and associated data of these cross sections are critical factors for understanding surface flow dynamics and assessing the vulnerability of urban areas to potential floods. This effectively supports urban planning decisions and preventive flood risk management.
3.3.2. Water Depth
Water depth in HEC-RAS refers to the difference between the water surface elevation and the ground elevation. This tool is used to analyze flood risks and estimate impacts on infrastructure or populations. It is also employed to create depth and hazard maps (Dasallas et al., 2019).
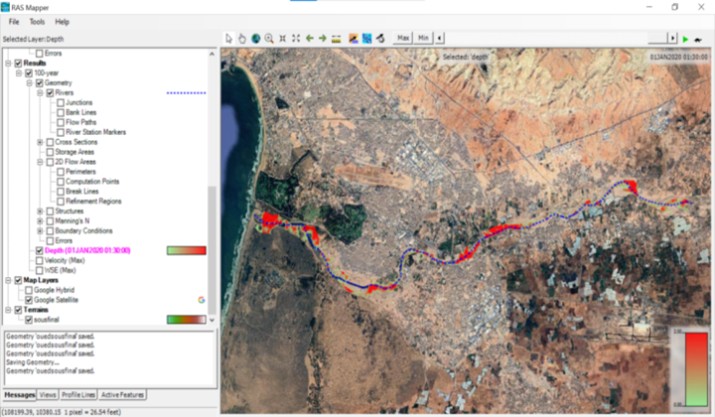
For the study area, as illustrated in Figure 6 extracted from HEC-RAS, the maximum water depth during flood periods reaches up to 2 meters, considering a return period of 100 years.

This depth is concentrated in the far north, center, and south of the study area. Most of these zones are sparsely populated, meaning they are areas located away from the riverbanks. The exception is the central area (between the northernmost part of Aït Melloul and the southernmost part of Agadir), which is distinguished by the presence of built-up and agricultural lands.
Through the analysis of floodwater depth distribution maps and the observation of flow paths from upstream to downstream areas, it becomes evident that the regions most exposed to flood risks are highly concentrated in the central part of the study area, as shown in Figure (7-b). These results highlight the presence of water accumulation zones caused by weak slopes or narrow channels, which significantly increase the likelihood of material or human losses.
This risk concentration in the heart of the Lower Souss Valley reflects the spatial vulnerability and inadequacy of the drainage infrastructure, particularly during sudden and intense rainfall events. Such findings underscore the urgent need for planning and engineering interventions to reduce the severity of flood impacts and to ensure a higher level of spatial safety.

The results of the hydraulic simulation using the HEC-RAS model applied to the Lower Souss Valley revealed that several residential neighborhoods within the study area are classified as high-risk flood zones. Specifically, these include Hay Al Amal, Tamersit, Azrou, Al Qods, Derb Tissir, and Mohammed V Avenue.
Flood inundation maps generated from simulations of various storm recurrence scenarios (as illustrated in Figure 7-b) show that surface runoff from heavy rainfall is not confined to the main riverbed of Oued Souss, but overflows both the right and left banks, leading to water intrusion into adjacent urban areas. This overflow reflects the river channel’s inability to accommodate floodwater volumes and highlights the insufficient drainage infrastructure in the study area, especially in low-lying and gently sloped zones.
The summarized results in Table 1 highlight significant spatial variability in flood hazard across neighborhoods in the Lower Souss Valley. Areas such as Hay Al Amal, Al Qods, and Mohammed V Avenue exhibit the highest flood depths (around 1.0–1.2 m) and flow velocities (0.6–0.8 m/s), corresponding to a high level of flood risk. These low-lying urban areas are particularly vulnerable due to their proximity to natural watercourses and dense built-up environment, which exacerbate water accumulation and limit drainage efficiency. Moderate risk zones, such as Tamersit, Azrou, and DerbTissir, show lower water depths (0.6–0.9 m) and flow velocities (0.3–0.5 m/s), yet they still require attention in urban planning and flood mitigation strategies. Overall, the table illustrates the practical utility of integrating HEC-RAS 2D simulations with GIS for spatially explicit flood risk assessment, providing actionable insights for targeted risk reduction measures and infrastructure planning.
|
Table 1. Summary of Flood Depth, Flow Velocity, and Risk Level by Neighborhood in the Lower Souss Valley. |
|||
|
Neighborhood (Hay) |
Water Depth (m) |
Flow Velocity (m/s) |
Flood Risk Level |
|
Hay Al Amal |
1.2 |
0.8 |
High |
|
Tamersit |
0.9 |
0.5 |
Medium-High |
|
Azrou |
0.6 |
0.3 |
Medium |
|
Al Qods |
1.0 |
0.6 |
High |
|
DerbTissir |
0.7 |
0.4 |
Medium |
|
Mohammed V Avenue |
1.1 |
0.7 |
High |
3.3.3. Flow Velocity
Flow velocity is one of the key hydraulic parameters used to assess water dynamics within watercourses or over land surfaces. It is expressed in meters per second (m/s). In HEC-RAS, this feature is used to identify areas vulnerable to erosion and scouring, and to evaluate the potential threat to people and property posed by floods, since high velocities are often associated with greater risks. These data are also fundamental for designing hydraulic structures such as channels and bridges and for comparing permissible velocities with actual calculated values to assess infrastructure stability (HEC-RAS, River Analysis System, 2016).
Based on the hydraulic modeling results for the Lower Souss Valley, Figure 8 shows that peak flood flow velocities range between 0 and 2 meters per second. Most of the study area records low flow velocities, below 1 m/s, indicating relatively stable flow in the flatter zones. In contrast, steeper upland areas, especially along slopes, experience relatively high flow velocities, increasing the likelihood of scouring and soil erosion, thus intensifying flood risk at these critical points. In built-up areas previously identified as flood-prone, flow velocity can reach up to 2 m/s, which significantly increases the potential for damage and negative impacts during flooding events.
3.3.4. Water Surface Elevation
The water surface elevation is one of the key hydraulic indicators, representing the vertical height of the water surface at a specific point, relative to a known reference elevation, such as sea level or local ground level. This metric is crucial in flood scenario assessment, as it helps determine whether the water level will exceed the natural banks of river channels and potentially inundate adjacent areas (Sulianto et al., 2018).

In the case of the study area in the Lower Souss Valley, and as shown in Figure 9, the water surface elevation ranges from just 3 meters in the far downstream section near the outlet to 35 meters at the highest points in the study area, particularly in the northeastern zone characterized by notable topographic elevation. This variation in elevation reflects the sloping nature of the terrain, which directly influences surface runoff behavior and flood severity.
According to the distribution of water surface elevation derived from the digital modeling, areas located in topographical depressions, especially residential neighborhoods near the Souss River are the most prone to inundation during flash flood events, due to their proximity to the lowest elevation levels. This reduces the natural water retention capacity of the area. Conversely, the relatively elevated zones may act as rebound points for fast-flowing water, intensifying flood risk in zones of accumulation and shared slope convergence.

3.3.5. Longitudinal Profile Analysis of the 100-Year Flood Model Lower Souss Valley
To deepen the analysis of the obtained results, a longitudinal profile analysis was conducted covering all parts of the study area from the river mouth eastward to the farthest point. This aims to understand the flow dynamics during the flood period.
The longitudinal profile also helps identify low points within the study area where floodwaters tend to accumulate. This assists in pinpointing locations with steep slopes that may increase flow velocity and pose risks to infrastructure such as bridges and roads (HEC-RAS, River Analysis System, 2016).
This graph (Figure 10) represents the longitudinal profile of the Lower Souss Valley, generated by running the HEC-RAS model to simulate a 100-year return period flood, dated July 19, 2025.

To apply a geographical approach to the analyzed profile, we note the following during the description phase:
1. Dashed black line: Represents the topographic shape of the river channel, i.e., the ground elevation at each cross-section. Noticeable changes in elevation appear as we move eastward toward the upper reaches of the river.
2. Light blue color (WS Max WS): Represents the maximum water surface elevation during the flood, a key element in determining the potential severity of the flood. We observe that this water surface elevation gradually increases with the rising ground elevation, reflecting a natural alignment with the topographic slope.
3. Dashed green line (EG Max WS): Represents the energy grade line, which expresses the total energy of the flow. The closer this line is to the water surface line, the more stable the flow.
4. Dotted red line (Crit Max WS): Represents the critical water surface elevation. When it approaches the blue line, it indicates rapid flow or turbulent conditions.
In the interpretation and analysis phase, we note:
· Gradual change in water level: The profile shows a gradient in topographic elevation, with an increase in water surface elevation as we move eastward, reflecting the natural slope characteristics of the valley.
· Presence of low-lying areas: In the initial section, there appear to be low areas that act as water retention points, increasing the likelihood of flooding.
· Flow stability: The proximity of the blue (WS) and green (EG) lines indicates that the flow is relatively stable and calm in most sections, with no signs of violent flows or critical turbulence.
· Minor irregularities in the profile: These may suggest the presence of structures or bridges that could affect the flow and cause local congestion. These points should be carefully studied in urban planning to prevent flooding.
This longitudinal profile provides an in depth understanding of flow dynamics during a rare flood event (100-year flood) and serves as a fundamental tool to identify critical risk points and evaluate the effectiveness of infrastructure in directing water flow.
4. DISCUSSION
The 2D HEC-RAS simulation results for the Lower Souss Valley highlight marked spatial variability in flood hazard, with the highest water depths and flow velocities concentrated in centrally urbanized districts such as Hay Al Amal, Tamersit, Azrou, Al Qods, Derb Tissir, and Mohammed V Avenue. These patterns emphasize the vulnerability of densely built environments located along low-lying floodplains and constrained drainage corridors. Similar findings have been reported in Mediterranean and North African cities where rapid urbanization, insufficient stormwater infrastructure, and land pressure in riverine terraces amplify exposure to extreme floods (Elkhrachy al., 2021; Kaya et al., 2022; Bouaziz et al., 2021). The spatial consistency between modeled flood extents and documented historical inundation areas reinforces the reliability of the simulation for practical flood-risk assessment.
4.1. Model limitations and uncertainties
Despite the robust spatial outputs, certain limitations merit acknowledgement. The 30-m DEM resolution, while widely used in data-scarce environments, may underestimate localized flow pathways in narrow streets and micro-depressions. Rainfall inputs obtained from regional meteorological stations may not fully capture the variability of convective storm cells that characterize Mediterranean climates. Importantly, model calibration was primarily qualitative due to the limited availability of continuous in-situ hydrological observations. Calibration relied on official municipal reports, historical records of past flood events, and expert interpretation of inundation footprints rather than systematic flow or depth measurements. This qualitative validation approach aligns with common practices in data-limited Mediterranean and North African basins (Tramblay et al., 2023; Ahmadlou et al., 2021). Consequently, model results should be interpreted with caution in highly compartmentalized urban areas, while future work should seek to integrate high-resolution LiDAR surveys, real-time gauge networks, and field-based flow measurements to enhance statistical calibration.
4.2. Policy implications, early-warning potential, and risk communication
Beyond risk mapping, simulation outputs provide actionable intelligence for flood-risk governance. Identified hotspots should be prioritized for reinforced drainage systems, riverbank stabilization, controlled development zones, and nature-based retention solutions. Importantly, hydraulic modeling constitutes a foundational tool for early-warning systems, enabling authorities to anticipate peak-flow corridors and disseminate timely alerts. Moreover, maps and scenario-based flood footprints can strengthen public awareness campaigns and community preparedness, supporting transparent risk communication and informed decision-making. Such integration between modeling and governance aligns with growing climate-adaptation agendas across Mediterranean urban settings.
4.3. Climate change relevance and regional transferability
Projected increases in rainfall intensity and shorter return periods under climate change scenarios heighten the importance of hydraulic modeling for Moroccan cities. Intensified convective storms and rising sea levels, already observed across Mediterranean coasts, are expected to exacerbate flash-flood hazards in semi-arid urban basins like Agadir (IPCC, 2022; Tramblay et al., 2020). The methodological approach applied here is transferable to other rapidly expanding North African cities, such as Algiers, Tunis, Tripoli, and Alexandria, which face similar geomorphological constraints and data-availability challenges (Bouaziz et al., 2021; Hamdi et al., 2015). Future research should integrate high-resolution remote-sensing products, IoT-based hydrometric sensors, and socio-economic vulnerability indices to build holistic flood-risk platforms. Incorporating climate-change scenario simulations will further reinforce the adaptive value of such modeling frameworks and support resilient urban development strategies.
5. CONCLUSIONS
The study demonstrated that the lower Souss Valley represents one of the most flood-prone urban areas in the southern periphery of Agadir. This vulnerability results from the interaction between natural topography and anthropogenic transformations. The analysis revealed that the valley's flat morphology delays runoff drainage, while rapid urban densification and the expansion of informal settlements along river corridors have intensified exposure to flood risks. Furthermore, the recurrence of extreme rainfall events linked to climate variability amplifies these risks.
By integrating the HEC-RAS hydraulic model with GIS-based spatial analysis, the study successfully simulated flood dynamics and identified critical areas characterized by high water levels and flow velocities, particularly in the neighborhoods of Al Amal, Azrou, Tassir, Al Qods, Tamarsit and Mohammed V Street. These results provide explicit spatial guidance on areas where flood management should be prioritized.
Based on these results, several planning and management implications emerge. First, the high-risk areas delineated by the model should guide municipal authorities in designing flood-resilient urban plans, limiting construction in flood-prone areas, and rehabilitating drainage systems. Second, the creation of flood retention basins and green buffer zones along river banks could reduce peak flows and improve infiltration. Third, early warning systems and flow monitoring stations should be developed to improve risk preparedness and real-time response capabilities.
Overall, this study provides a decision-support framework linking hydrological modeling results to spatial planning tools. Effective flood mitigation in the lower Souss Valley therefore, requires an integrated and participatory approach combining scientific analysis and policy implementation, anchored in sustainable urban development and the protection of people and infrastructure.
REFERENCES
- Ahmadlou, M., Al-Fugara, A., Al-Shabeeb, A. R., Arora, A., Al-Adamat, R., Pham, Q. B., Al-Ansari, N., Linh, N. T. T., & Sajedi, H., 2021. Flood susceptibility mapping and assessment using a novel deep learning model combining multilayer perceptron and autoencoder neural networks. Journal of Flood Risk Management, 14(1), https://doi.org/10.1111/jfr3.12683.
- Berdgue, H., 2017. Genèse et gestion des risquesd’inondations dans les zones urbaines: Cas de la villed’Agadir (Maroc). SciencesConf. https://villedurable.sciencesconf.org/data/program/GENESE_ET_GESTION_DES_RISQUES_D_INONDATIONS_DANS_LES_ZONES_URBAINES_CAS_DE_LA_VILLE_D_AGADIR_MAROC_1.pdf
- Bouaziz, M., Medhioub, E., & Csaplovisc, E., 2021. A machine learning model for drought tracking and forecasting using remote precipitation data and a standardized precipitation index from arid regions. Journal of Arid Environments, 189, 104478. https://doi.org/10.1016/j.jaridenv.2021.104478.
- Dasallas, L., Kim, Y. & An, H., 2019. Case study of HEC-RAS 1D–2D coupling simulation: 2002 Baeksan flood event in Korea. Water, 11(10), 2048, https://doi.org/10.3390/w11102048.
- Elkhrachy, I., Pham, Q. B., Costache, R., Mohajane, M., Rahman, K. U., Shahabi, H., Linh, N. T. T., & Anh, D. T., 2021. Sentinel-1 remote sensing data and Hydrologic Engineering Centre’s River Analysis System (HEC-RAS) for flood hazard mapping: A case study in the Middle East. Journal of Flood Risk Management, 14(6), https://doi.org/10.1111/jfr3.12692.
- Hamdi, Y., Bardet, L., Duluc, C.-M., & Rebour, V., 2015. Use of historical information in extreme-surge frequency estimation: The case of marine flooding on the La Rochelle site in France. Natural Hazards and Earth System Sciences, 15(7), 1515–1531, https://doi.org/10.5194/nhess-15-1515-2015.
- Hemmati, M., Ellingwood, B. R., & Mahmoud, H. N., 2020. The role of urban growth in resilience of communities under flood risk. Earth’s Future, 8(3), https://doi.org/10.1029/2019EF001382.
- Hydrologic Engineering Center (HEC), 2016. HEC-RAS River Analysis System: User’s manual (Version 5.0). U.S. Army Corps of Engineers, https://www.hec.usace.army.mil/software/hec-ras/documentation.aspx.
- Hydrologic Engineering Center (HEC), U.S. Army Corps of Engineers, 2023. HEC-RAS River Analysis System: User’s Manual (Version 6.6). Davis, CA, USA. Retrieved from https://www.hec.usace.army.mil/software/hec-ras/documentation.aspx
- Intergovernmental Panel on Climate Change (IPCC), 2022. Climate change 2022: Impacts, adaptation, and vulnerability. Contribution of Working Group II to the Sixth Assessment Report of the Intergovernmental Panel on Climate Change. H.-O. Pörtner, D. C. Roberts, M. Tignor, E. S. Poloczanska, K. Mintenbeck, A. Alegría, M. Craig, S. Langsdorf, S. Löschke, V. Möller, A. Okem, & B. Rama (Eds.). Cambridge University Press, https://doi.org/10.1017/9781009325844.
- Kaya, Y. Z., Üneş, F., & Demirci, M., 2022. Flood modeling based on the precipitation data by using HEC-RAS software version (5.0.7). In Proceedings of the “Air and Water – Components of the Environment” 2022 Conference (pp. 47–56). Cluj-Napoca, Romania, https://doi.org/10.24193/AWC2022_05.
- Khosrowpanah, S., Lander, M. A., & Patil, U. D., 2019. Development of the stage–flow relations for a tropical watershed. Hydrology, 7(3), 38–45. https://doi.org/10.11648/j.hyd.20190703.11
- Mekkaoui, O., Morarech, M., Bouramtane, T., Barbiero, L., Hamidi, M., Akka, H., & Rengasamy, R. P. M., 2025. Unveiling urban flood vulnerability: A machine learning approach for mapping high risk zones in Tetouan City, Northern Morocco. Urban Science, 9(3), 70, https://doi.org/10.3390/urbansci9030070.
- Meraj, G., Khan, T., Romshoo, S. A., Farooq, M., Rohitashw, K., & Sheikh, B. A., 2019. An integrated geoinformatics and hydrological modelling-based approach for effective flood management in the Jhelum Basin, NW Himalaya. Proceedings, 7(1), 8, https://doi.org/10.3390/ECWS-3-05804
- United Nations Office for Disaster Risk Reduction, 2022. Global Assessment Report on Disaster Risk Reduction 2022: Our world at risk – Transforming governance for a resilient future. Geneva, Switzerland: UNDRR. Retrieved from https://www.undrr.org/gar2022-our-world-risk-gar.
- UNDRR & CRED, 2020. Human cost of disasters: An overview of the last 20 years 2000–2019. United Nations Office for Disaster Risk Reduction (UNDRR) and Centre for Research on the Epidemiology of Disasters (CRED). Retrieved from https://www.undrr.org/publication/human-cost-disasters-overview-last-20-years-2000-2019
- Satour, N., Raji, O., El Moçayd, N., Kacimi, I., & Kassou, N., 2021. Spatialized flood resilience measurement in rapidly urbanized coastal areas with a complex semi-arid environment in northern Morocco. Natural Hazards and Earth System Sciences, 21(3), 1101-1118, https://doi.org/10.5194/nhess-21-1101-2021.
- Scharffenberg, W., & Fleming, M., 2010. Hydrologic Modeling System HEC-HMS version 3.5: User’s Manual. U.S. Army Corps of Engineers, Hydrologic Engineering Center, Davis, CA. https://www.hec.usace.army.mil/software/hec-hms/documentation/HEC-HMS_Users_Manual_3.5.pdf
- Smith, K., Fearnley, C. J., Dixon, D., Bird, D. K., & Kelman, I., 2023. Environmental hazards: Assessing risk and reducing disaster (7th ed.). Routledge. https://doi.org/10.4324/9781351261647
- Sulianto, A. A., Lusiana, N., & Murakami, K., 2018. Characteristics of tsunami-flow over a breakwater with three-dimensional configuration. In Proceedings of the International Conference on Asian and Pacific Coasts (APAC) 2017 (pp. 239–246). Singapore: World Scientific, https://doi.org/10.1142/9789813233812_0029.
- Tramblay, Y., Arnaud, P., Artigue, G., Lang, M., Paquet, E., Neppel, L., & Sauquet, E., 2023. Changes in Mediterranean flood processes and seasonality. Hydrology and Earth System Sciences, 27, 2973–2987, https://doi.org/10.5194/hess-27-2973-2023.
- Tramblay, Y., Koutroulis, A., Samaniego, L., Vicente-Serrano, S. M., Volaire, F., Boone, A., Le Page, M., Llasat, M. C., Albergel, C., Burak, S., Cailleret, M., Kalin, K. C., Davi, H., Dupuy, J. L., Greve, P., Grillakis, M., Hanich, L., Jarlan, L., Martin-StPaul, N., Martínez-Vilalta, J., Mouillot, F., Pulido-Velazquez, D., Quintana-Seguí, P., Renard, D., Turco, M., Türkeş, M., Trigo, R., Vidal, J. P., Vilagrosa, A., Zribi, M., & Polcher, J., 2020. Challenges for drought assessment in the Mediterranean region under future climate scenarios. Earth-Science Reviews, 210, 103348, https://doi.org/10.1016/j.earscirev.2020.103348.
- Zhang, Z., Zhang, J., Zhang, Y., Chen, Y., & Yan, J., 2023. Urban flood resilience evaluation based on GIS and multi-source data: A case study of Changchun City. Remote Sensing, 15(7), 1872. https://doi.org/10.3390/rs15071872.