1. INTRODUCTION
The digital era we find ourselves in has led to an exponential growth of information in geosciences. As global education hurtles into an increasingly technologically-strong future, we are at risk of having a skills shortage for these interaction-oriented research-teaching-learning opportunities. Moreover, the year 2020 brought a dramatic change for world-wide education, attributed to the coronavirus pandemic (SARS-CoV-2). As per the data available from the UNESCO (2020), as of 25th April 2020, school functions have been affected globally with 164 countries having nationwide school closures. This has led to around 82.1% of registered learners being affected which is about 1.4 billion young people.
Looking at the evolution of the technology industry, it is clear that 3D technologies are a natural progression and contribute to enhancing scientific, learning and cultural heritage environments in the field of Geosciences. Since the early 2000s remote sensing techniques like ALS (Airborne Laser Scanning, sometimes also called LiDAR - Light Detection and ranging), TLS (Terrestrial Laser Scanning), and SfM-MVS (Structure from motion - Multi-View Stereo), have been applied in many fields of geosciences to capture digital terrain models (Heritage and Hetherington, 2007; Hodge et al., 2009; Schaefer and Inkpen, 2010; Meza et al., 2019). The differences between these digital surveys are well known and extensively discussed (Westoby et al., 2012; Young, 2012; Carrivick et al., 2016). Due to the technological progress in computer vision (i.e., better hardware and software solutions), in recent years special attention has been granted to SfM-MVS photogrammetry because is low-cost, fast, non-invasive, easy to undertake, high resolution, offers a highly portable solution and scalability for digital characterization (Westoby et al., 2012; Micheletti et al., 2015; Carrivick et al., 2016; Smith et al., 2016). SfM technology has been in continuous development since the 1980s, which can be summarized as a process of generating three-dimensional geometry from several overlapping two-dimensional images (Ullman, 1979; Longuet-Higgins, 1981).
Digital reconstruction using SfM-MVS techniques has been successfully applied in many geomorphological studies (see Westoby et al., 2012) and references therein); for monitoring mining activity (Wajs, 2015), as a tool for the digitization of drill core samples (Betlem et al., 2020), or even for rockfall analysis (Vanneschi et al., 2019). Svennevig et al. (2015) have used successfully the oblique photogrammetry to reconstruct the 3D geological models of outcrops. Recently, Caravaca et al. (2020) used the SfM-MVS technology for a 3D digital reconstruction model of the Kimberley outcrop (Gale crater, Mars). Recent studies showed that SEM micrographs are suitable for 3D reconstruction by photogrammetry (Eulitz and Reiss, 2015; Dumitriu et al., 2021). Moreover, the SfM-MVS has become popular in archaeology (De Reu et al., 2013), cultural heritage (Milosz et al., 2020), and paleontology (Schemm-Gregory and Henriques, 2013) as an effective and low-cost method for generating 3D models. Mineralogical and petrological approaches for the acquisition of mineral and rock texture data are now facing a high demand in the online learning platforms, with both a substantial increase in the number of three-dimensional geological samples and the possibility to share and re-use the 3D content in different approaches (educational, research, or cultural heritage projects). SfM-MVS has been successfully applied in petrological observations, where the 3D models were embedded into the PDF file by using the universal 3D file format (Buzgar et al., 2013). Datasets of 3D models of minerals and rocks are available online (Perkins et al., 2019; Andrews et al., 2020) and offline (Dumitriu and Balan, 2017). Applications of SfM-MVS in geological virtual field trips were also developed in the past few years (De Paor, 2016; Cho and Clary, 2020).
Geological samples have long been used for different purposes, from simple collection hobby to scientific and teaching material. Fieldwork and laboratory studies provide essential and formative educational experiences for Earth Sciences students. However, it is very difficult for students to engage in a diverse range of field experiences or to view and manipulate minerals, rocks, maps, or other educational materials outside of laboratory studies. In this regard, trends of known and respected universities (e.g., Cawood and Bond, 2019; Perkins et al., 2019; Andrews et al., 2020) and museums (e.g. Smithsonian Museum (https://3d.si.edu), British Geological Survey (http://www.3d-fossils.ac.uk)) are to offer seminars and other forms of educational activities, at no cost and with open-access web workshops. Furthermore, 3D technologies applications like virtual reality (VR), augmented reality (AR) and mixed reality (MR) evolved tremendously in recent years, especially in cultural heritage for reconstructing historical environments (Bruno et al., 2010) and for creating interactive, engaging and immersive experiences in museum environments (Carrozzino and Bergamasco, 2010), educational games (Ferdani et al., 2020), or peer assessment studies (Chang et al., 2020).
Unfortunately, previous studies of a 3D digital reconstruction of minerals and rocks (Dumitriu and Balan, 2017; Perkins et al., 2019; Andrews et al., 2020) have reported several limitations (i.e., glossy and transparent samples) that minimize the feature-matching process of the SfM-MVS workflow. Transparent, translucent, and opaque samples pose a series of problems that are not yet solved: (i) different degrees of transparency, translucency, and glossiness, specific for each sample, can be problematic in the feature detection stage of the SfM-MVS workflow; (ii) for capturing these properties when the sample is homogeneous or has complex morphology, can be a difficult task; (iii) specific properties of mineral samples like internal reflections, inclusions, optical phenomena (i.e., iridescence, chatoyance, etc.) cannot be assessed. Moreover, these limitations also minimize the perceptual information and the user experience in the dissemination stages.
Photogrammetry workflows, as currently practiced in many fields of geoscience, are very flexible. The 3D model is processed using many parameters, in terms of software and hardware. The sample and scene preparation, equipment, image-capture routines, SfM-MVS parameters, and post-processing procedures are all driven by the user. The common limitations in 3D digital reconstruction and the lack of standardization during image acquisition and SfM-MVS processing adds flexibility as users can modify the equipment and settings to suit their individual needs. The limitations, versatility, and high degrees of manual input in the 3D reconstruction process, however, can also lead to a higher variation of the final 3D model.
In this paper, we explore the common issues affecting the quality of the 3D models of rocks and minerals. This work aims to overcome these issues. In particular, it aims to provide geoscientists with the information they need to select an appropriate methodology for any particular 3D model, to control the pitfalls and limitations of the SfM-MVS technology, and to provide suggestions for carrying out work with maximal efficiency. This paper seeks to provide students of geology an interactive scientific and learning environment in the field of Geosciences. Furthermore, the 3D reassessment of the collection will be done not only for pedagogical and scientific purposes but also for digital heritage perspectives. To accomplish these aims, we present a comprehensive online repository that contains 3D digital models of minerals, rocks, and related 3D visualizations for fellow researchers, educational institutions, and the general public. The virtual collection is aimed to be used as teaching material for Mineralogy, Petrography, Crystallography, and other related disciplines.
2. MATERIALS AND METHODS
2.1. Minerals and Rocks sample collection
The collection is made available to this project by the “Grigore Cobălcescu” Museum of the Department of Geology, “Alexandru Ioan Cuza”, University of Iaşi, Romania. The museum has more than 25,000 samples of minerals, gemstones, and rocks from all over the world, and only 6,500 are currently indexed in the database (http://geology.uaic.ro/muzee/mineralogie). Most of them come from the territory of Romania and cover all the mineral classes and common igneous, metamorphic, and sedimentary rocks. The oldest samples belong to the Krantz collection, purchased by Prof. Grigore Cobălcescu in 1888 from Dr. F. Krantz, Rheinisches Mineralien-Kontor, Bonn, Germany.
2.2. Software and hardware for SfM-MVS processing
SfM-MVS software for 3D reconstruction has developed rapidly, ranging from open-source and commercial software to web-based and cloud computing services, enabling non-experts to quickly and easily reconstruct the 3D model. Most of these packages are already discussed and benchmarked in detail (e.g., Carrivick et al., 2016; Nikolov and Madsen, 2016; Smith et al., 2016; Rahaman et al., 2019). Nowadays, 3D reconstruction can be performed by several different methodologies and hence aimed for specific types of models/environments (De Reu et al., 2013; Hasiuk, 2014; Erolin et al., 2017; Rahaman et al., 2019; Riquelme et al., 2019). In this paper, we are going to use the Agisoft Metashape software (formerly known as PhotoScan) (Agisoft, 2020) that implements SfM-MVS algorithms, one of the most widely used SfM-MVS solutions in geoscience (Carrivick et al., 2016).
In general, SfM-MVS processing times vary depending on the number and resolution of the images, and on various parameters for each stage of the 3D reconstruction process. To take the advantages of parallel processing and multiple cores (both on the CPU and GPU), the data processing was performed using a custom-build workstation PC equipped with the following hardware: AMD Ryzen 9 3950X 3.5GHz with 16 cores and 32 processing threads, two graphic cards (1 x NVIDIA GeForce RTX 2080s 8 GB RAM and 1 x NVIDIA GeForce 1080Ti 11 GB RAM), 64 GB of DDR4 RAM and 64-bit operating system (Windows 10) running on a fast SSD. A high-end graphical card(s) and multi-core processor is essential to avoid long hours of processing. The 3D rocks and minerals models were created using photographs captured with a custom-built photogrammetry rig (Table 1).
|
Table 1. Components of the cross-polarized light photogrammetry rig |
||
|
Component |
Alternatives |
Purpose |
|
A professional digital camera with high-quality lenses |
Smartphone camera |
Image acquisition (digital photos) |
|
Remote-control release for a digital camera (wired, infrared, or via Wi-Fi) |
- |
Used to avoid camera shake |
|
Commercial lightbox studio with light diffusion capabilities and white/black matte background |
A light tent made by sturdy cardboard box and sheets of bright white/black poster board to use for the backdrop |
Sample illumination and enables obtaining soft and diffuse light |
|
Motorized turntable with custom control |
Kitchen turntable (Lazy Susan turntable) |
Serves as a rotating platform, used to rotate the sample |
|
2-3 LED lights at 5500K for natural color (with dimmable LED panels) |
Natural light or spotlights |
Sample illumination |
|
Color calibration charts |
- |
For achieving accurate capture of color-accurate textures through a proper digital camera calibration |
|
Steady tripod with ball head |
- |
Provide a stable and secure position |
|
Circular polarizing filters for the camera lens (different diameters for each lens) |
- |
Eliminates or subdues reflections, glare, and highlights from the surfaces of the minerals and rocks |
|
Linear polarizing films for the light sources |
- |
|
|
Anti-reflection coating spray (developer spray, anti-glare spray, etc.) |
Aerosol can with inert mineral powder (i.e., talc, anatase, montmorillonite) |
|
|
Adhesive paste |
Silicon heat gun |
Sample support |
|
Air blower and brush |
- |
Clean dust and/or specks particles |
3. PHOTOGRAMMETRY WORKFLOW PROCESS
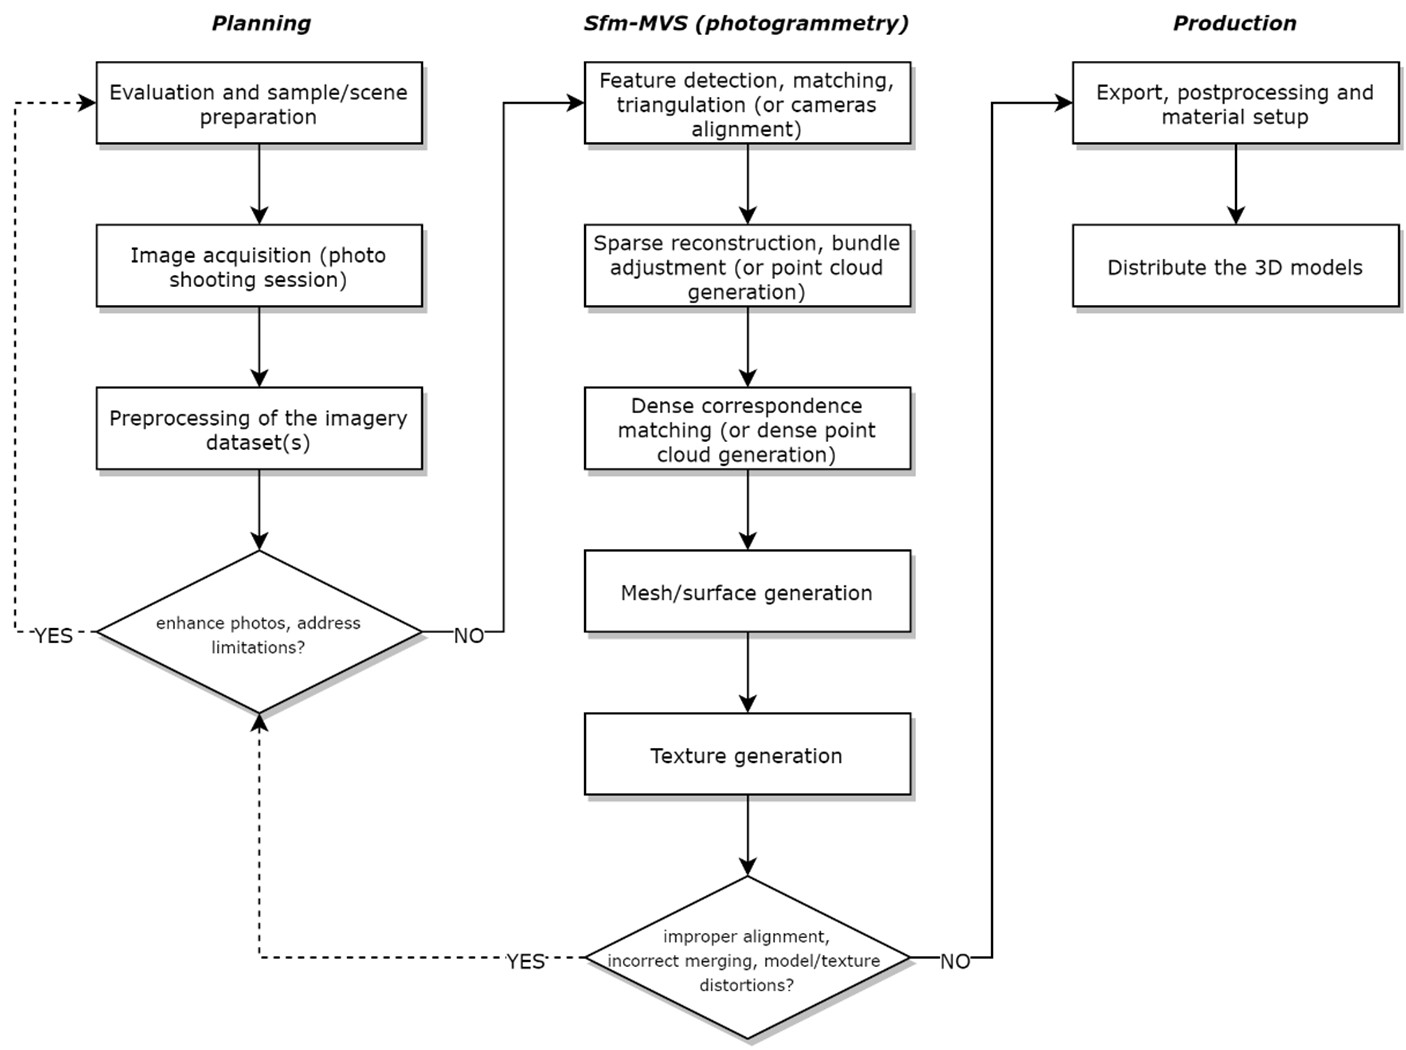
Generally, the SfM-MVS workflow process follows ten steps (Fig. 1) to create 3D rocks and minerals, which includes: (1) Evaluation and sample/scene preparation; (2) Image acquisition (photo shooting session); (3) Preprocessing of the imagery dataset(s); (4) Feature detection, matching, triangulation (or cameras alignment); (5) Sparse reconstruction, bundle adjustment (or point cloud generation); (6) Dense correspondence matching (or dense point cloud generation); (7) Mesh/surface generation; (8) Texture generation; (9) Export, postprocessing and material setup; and (10) Distribute the 3D models. However, the overall 3D reconstruction pipeline can be summarized in three main components: Planning, SfM-MVS (photogrammetry), and Production.
3.1. Planning
3.1.1 Evaluation and sample/scene preparation
To carry out the data capture, an initial evaluation and sample/scene preparation is mandatory for better results. For specific samples (i.e., with glossy surfaces) this stage can be essential for a proper SfM camera alignment process. Therefore, depending on the nature of the sample and the level of detail, careful planning of the image acquisition is required.
In this step, the specimen should be gently cleaned of dust and/or specks particles. The ideal way to do this is by using an air blower that sweeps off dust/specks and then gently wiping the surface to clean fingerprints, if any. Certain dust particles and fingerprints cannot be removed by using an air blower. This can be solved by using a brush to remove the dust particles by just brushing it off.
Lighting conditions are one of the main parameters that can affect the feature detection step of the SfM-MVS reconstruction workflow, and finally, the quality of the 3D model. This is because the relationship of the sample to the light sources changes by moving or rotating a sample in a scene. As a result, it may modify the pattern of shadows cast on the sample surface, which may afterward disrupt the ability of SfM-MVS software to properly find consistent key points between images. By using SfM-MVS reconstruction, some problems remain, such as occlusion and shading, but these can be minimized with proper lighting, without harsh shadows or reduced shadow effect. In this regard, if the sample is not homogenous illuminated, additional lighting can be added to the scene (i.e., increase the LED brightness).
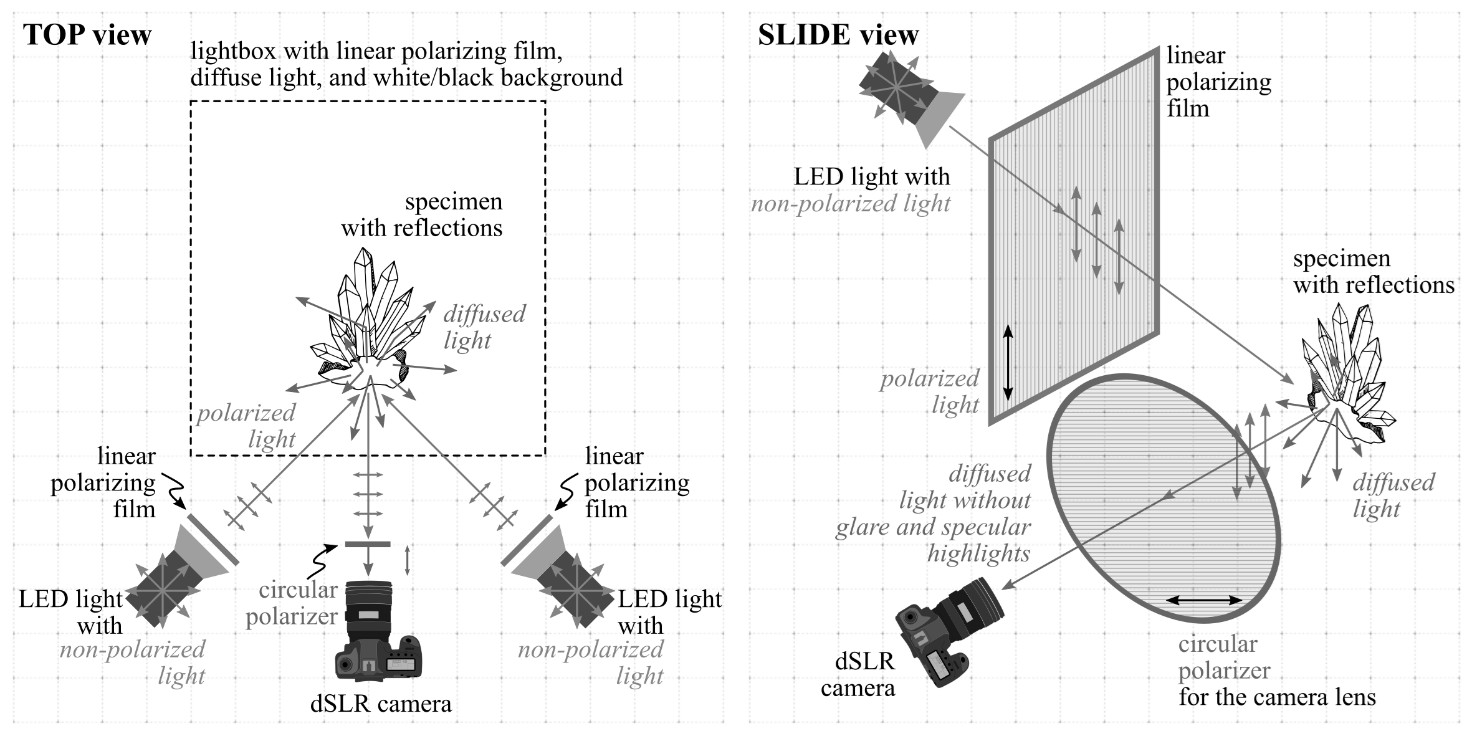
On the other hand, to reduce the light components (i.e., glare and specular highlights) from a sample with a glossy surface(s), the cross-polarized light photography (CPL) method is used. Luster is the property that has the biggest importance to the correct setup of the lighting scene and represents the way that light interacts with the surface of the minerals. In this regard, metallic (e.g., pyrite), submetallic (e.g., sphalerite), vitreous (e.g., quartz), pearly (e.g., muscovite), and adamantine (e.g., diamond) are the most challenging properties for photogrammetry reconstruction.
Polarization is a distinct property of light that defines both the way light is transmitted, scattered, refracted and reflected by different minerals, and the relative orientations of the waves as they propagate. Cross-polarized light photography is an effective way of taking two linear polarizers – a linear polarizing film at the light source and a circular polarizing filter on the lens – and rotating both polarizers, in opposition to each other, to further dim the light component (i.e., light extinction, crossing each other by 90°). The LED light can be diffused or reflected from any surface of the sample. Color and texture are given by diffused light, while brightness is given by reflected light. While diffused light loses its polarization, reflected light retains it. Therefore, when polarized light illuminates a mineral, the reflective surfaces of the sample also reflect polarized light (i.e., in the same direction), while on non-reflective surfaces the light is diffused (Fig. 2). The final step is to rotate the circular polarizer from the camera filter by 90° to extinguish all disturbing glare and highlights. When using polarized lighting, the camera will lose approximately 2 f-stops of light (depending on the quality of the polarizing filters), so a higher ISO setting and/or slow shutter speed will compensate for low-light conditions.
In the case of samples with homogeneous texture, it is recommended to use small sticky colored labels that will help in the feature detection step and matching procedure of the SfM-MVS software. In addition to cross-polarized light photography method, an anti-reflection coating spray can be used to overcome the common limitations in 3D digital reconstruction, especially for the samples with translucid and transparent surfaces. However, it is not recommended to use anti-reflection coating spray on fragile samples.
Another challenge for photogrammetry is especially encountered for samples with less than 5 cm in size, where the depth of field (DoF) is the primary obstacle. Fortunately, an effective tool to restricted DoF has been successfully used by Gallo et al. (2014) using multi-focused image stacking. The small DoF can be problematic in the feature detection stage of SfM-MVS reconstruction. As a general rule, for samples smaller than 5 cm, we used stacked photos. The number of images needed to cover the entire focus range depends on the DoF extension. The stacking procedure is mandatory at least for the samples with a complex geometry, where the particular features/details are masked by the restricted DoF. Brecko et al. (2014) successfully benchmarked different software package solutions, both commercial and free ones. For the focus stacking procedure, we used the CombineZP software package.
3.1.2. Image acquisition, camera settings, and rotary table setup
The image acquisition was performed using a CANON EOS-5D MARK III DSLR camera at a maximum resolution of 5760 × 3840 pixels and equipped with various lenses (Canon EF 17-40mm f/4L USM, Canon EF 24-70mm f/4L IS USM, Canon MP-E 65mm f/2.8 1-5x Macro, and Canon EF 100mm f/2.8L IS USM Macro) to suit the different zoom/detail levels required for different samples. The images were taken using manual camera settings at a low ISO (100-800) and with a higher f-stop (10-14), mirror lockup (reduce blurs caused by camera vibrations). This leads to slow shutter speeds, so the camera is placed on a tripod to prevent motion blur. These camera settings reduce image noise by decreasing sensor sensitivity to light, and expand the depth-of-field, thus increasing the amount of usable information in each photograph. All photos were being taken in RAW image format to take the advantage of full dynamic range in the preprocessing of the imagery dataset. Color calibration charts were used to ensure color-accurate textures of minerals and rocks.
For each 3D model, the target sample was placed in the center of the turntable and was securely held upright using adhesive paste. Also, to avoid the movement of the sample during turntable rotation, the speed of each rotation step of the turntable must be kept to a minimum value with ease-in-out accelerating and decelerating settings. In general, this can be set up from the CNC software, or by manually rotating the turntable if no automated turntable is used. A series of 36 photos (36 steps/turn, at systematic intervals of 10°) was made to keep a high degree of overlap between consecutive photos (at least 80%). Another photo session is taken by slightly raising the camera and tilting it towards the target sample. Depending on the complexity of the sample, an additional round of 36 photos is recommended, with the camera tilted and oriented accordingly. This helps to capture more detail from the top of the sample. The target sample is then flipped 180°, and the process is repeated to capture the other side of the sample. In general, two photo sessions for each side (144 photographs) must be taken in a series to generate the 3D model. For samples that require stacking procedure and/or cross-polarized light photography, the number of photos can increase considerably (i.e., ~2000 photographs/sample).
3.1.3. Preprocessing of the imagery dataset
There is plenty of photo editing software available online, and within this study, the photographs are organized in a database managed by Adobe Lightroom Classic. The preprocessing of the taken images consists of brightness, contrast, sharpening, and white balance adjustments, which are mandatory especially when polarizing filters are used. Furthermore, these settings can vary from sample to sample. The biggest advantage of shooting in RAW format is that you can modify these settings without altering the original image data. After the processing step, the images are exported in TIFF format, to preserve as many details as possible. Unfortunately, both original and processed image files have a big impact on the size of storage (~ 6GB for 144 photographs).
3.2. SfM-MVS (photogrammetry) reconstruction of minerals and rocks
Many of the SfM-MVS software packages for 3D reconstruction have a typical workflow (Figure 3), however, each software package has different features, both paid and free software packages share clear commonalities. The key for “the best photogrammetry software” consists of the imagery dataset – a methodical, raw, sharp, broadly lit, robust image capture set is the key to producing a high-quality 3D model. It is important to know that the way you capture the images to get good, reproducible, and measurable results for SfM-MVS workflow is independent of the software you will use to process them. Photography and light setup are the foundation for everything that follows. Therefore, properly collected image sets can always be re-processed in other software at a later date (or by others).
A detailed comparison between different SfM-MVS software packages is previously discussed (Carrivick et al., 2016; Nikolov and Madsen, 2016; Smith et al., 2016; Rahaman and Champion, 2019; Rahaman et al., 2019). Because the features are subject to change as technology evolves (i.e., new hardware or SfM-MVS algorithms), and in order to better explain 3D reconstruction, a predominantly qualitative description of this workflow was considered.
The first stage of SfM reconstruction consists of feature detection, which is based mainly on the scale-invariant feature transform algorithm (Lowe, 2004), a well-known method implemented by many software packages. In this step, the algorithm calculates the orientation, scale and position of the camera for each photograph (Fig. 3a). Finally, a 3D sparse point cloud is generated, showing the geometry of the sample (Fig. 3b). In the case of a poor alignment, the process must be restarted and reconsidered by adding at least 4 control points (CPs) on at least 10 consecutive images of the sample. Agisoft Metashape software offers also ground control points (GCPs) by adding marker sheets during the photo session. This is a good alternative for samples that have overly homogeneous texture (i.e., sample lack in details for a proper camera alignment). Wrong positioning of control points could cause also an improper alignment of the photos. Different settings (i.e., key point and tie point limit, image masks, etc.) of the alignment procedure can provide improved results (see the user manual of each software package, e.g. Agisoft, 2020). The final accuracy of the model depends on this step, therefore a visual check of the image alignment is recommended. Generally, the improper alignment of the photographs adds unwanted distortions and blurry texture to the 3D model in the final stages of SfM reconstruction.
Once the sparse point cloud is finished, a dense point cloud is generated (Fig. 3c) by several MVS (multi-view stereo) processing algorithms. There is a wide variety of MVS algorithms (Seitz et al., 2006), and many of them are optimized for faster processing speeds depending on the software packages. At this stage, the processing time depends largely on the number and resolution of the photos, the desired details of the 3D shape model and the hardware used for computation (i.e., workstations with multiple GPUs are highly recommended). The next step consists of mesh generation (3D polygonal geometry), that can be visualized in wireframe, solid, or shaded mode (Fig. 3d). After the mesh reconstruction and before building the texture, the unwanted geometry/faces can be removed manually by using lasso selection, or by different semi-automatic detection algorithms of the software package (user manual, Agisoft (2020)). After the cleanup step of the 3D polygonal geometry, the model requires additional editing. Sometimes, due to the low-degree of overlapping images, the sparse point cloud and the 3D mesh shows some holes (missing 3D data) which can be easily solved by closing the holes. At this point, it is very important to optimize the 3D mesh by reducing the number of polygons as much as possible. Depending on geometrical complexity, a 3D model with polygons ranging between 500,000-700,000 is a good starting point. The number of polygons influences the quality of 3D mesh, the file size on the hard-drive, and finally in the dissemination stage, the impact on load time.
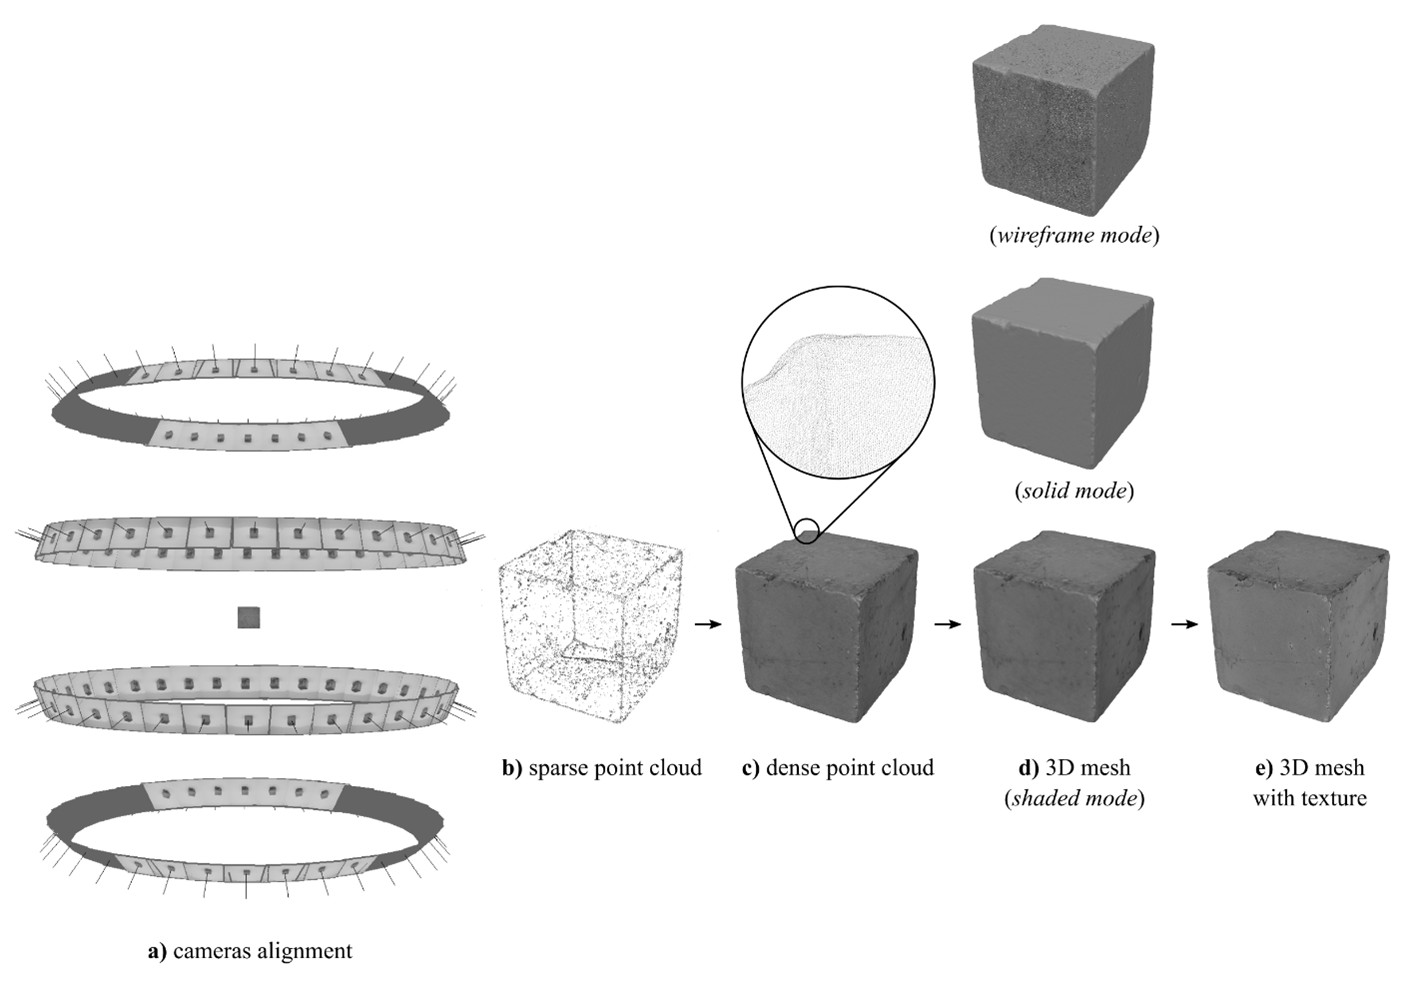
The next step of the 3D reconstruction process consists of texture generation (Fig. 3e). In this stage, the mesh surface is being parametrized and the photos are blended to form a texture atlas. The texture detailing for each polygon in the model is due to the mapping of the original photos on the mesh surface. Important observations, both in learning and scientific activities, can be made due to the high resolution of the 3D mesh and its associated texture. The file format and the level of compression can vary on the image attributes and channel requirements (i.e., RGB, Luminance, or Alpha). In general, a JPG file format of 4096 × 4096 pixel size gives a good balance between quality, hard drive space, hardware requirements, and download time.
3.3 Production
After the 3D reconstruction of minerals and rocks, each model needs to be exported. Before this, few more things must be checked: (i) place the mesh at the point of origin; (ii) orient the mesh to the right-side-up, and (iii) correct scale. Agisoft Metashape software supports several file formats (i.e., OBJ, 3DS, WRL, DAE, PLY, X3D, STL, FBX, GLB, DXF, U3D, or PDF file format) which ensures interoperability with all 3D software packages or online platforms that support 3D content. In order to use it in other software packages, the 3D mesh with texture is exported in Wavefront (OBJ) file format, along with the texture images and an associated material template library file (MTL), which is generated by Agisoft Metashape (diffuse- and ambient occlusion maps). Sometimes the texture (diffuse map) generated by the photogrammetry software, shows blurry parts caused by the low DOF in some photographs. This issue can be repaired with the texture painting tool in a 3D modeling software (e.g., Blender, Cinema4D, etc.) or by improving the DoF in the photo shooting stage.
While the general model has high quality and precision in its textures, depending on the nature of the sample (e.g., transparent and/or glossy surfaces), more texture shaders are needed in order to obtain the closest appearance to the real sample. For that, the Physically Based Rendering (PBR) texturing method is used. According to McDermott (2018), the PBR texturing is a way of creating photorealistic 3D objects by using a complex process of texture shading and rendering. This is a rendering method currently used by most 3D software (e.g. Blender) and web viewers (e.g. Sketchfab). The PBR texturing was successfully implemented in other 3D reconstruction studies (Ferdani et al., 2020). Some programs use metalness PBR workflow (also known as Metalness/Roughness) and others use specular PBR workflow (or Specular/Gloss) or a combination of these two. Both workflows have in common the use of diffuse-, normal-, and ambient occlusion maps. However, unlike the specular workflow which uses a specular texture to control the reflection amount/color, the metalness workflow depends on the metalness texture that uses a black/white map to affect the metallic and non-metallic surfaces. In order to obtain optimal results, it is necessary to use several different package software (Table 2), and sometimes this can be a drawback.
The combination of these textures (see Table 2) determines how the surface of the 3D sample reacts to the lighting. To apply the texture maps on the surface of the 3D model, a UV mapping technique is used, thus creating a 2D unwrapped surface of the 3D model polygons with the associated textures. The texture maps produced with the workflow presented in this study have been used to enhance the visualization of the samples and should not be considered standard values, each varying according to the processing workflow and capture setup.
A study by Champion & Rahaman (2019) suggests that very few 3D models are used for museum exhibitions, conferences, or digital reconstructions in movies and games, and most likely this is due to poor infrastructure. However, it seems to be more a metadata issue, being very difficult to find 3D models with descriptions and tags, or even more with representative titles.
Nowadays, there are impressive international online repositories with interactive 3D models for online exhibitions, educational and scientific use (e.g., Sketchfab - https://sketchfab.com; V-MUST - http://v-must.net; CARARE - https://carare.eu; Europeana - https://europeana.eu; Smithsonian - https://3d.si.edu; MorphoSource - https://morphosource.org; myFOSSIL - https://myfossil.org/; etc.). For the distribution of the 3D models, we use the Sketchfab platform, an online portal to publish, share, and discover 3D content. Sketchfab offers WebGL and WebXR technologies to view 3D models on multiple devices, such as mobile devices, desktop PCs, and VR headsets (Sketchfab, https://sketchfab.com). For this work, the Sketchfab platform was chosen due to the following capabilities: easy-to-use, free, wide-reaching community (more than 4 million active users), functionality (i.e., supports 3D annotation, audio, animations, VR, AR, etc.), and support for educational and cultural heritage institutions. That being said, the Sketchfab platform is now probably the best-known service for virtual heritage 3D models, with more than 650 museums enrolled in the Cultural Heritage program (Flynn, 2019).
Once hosted on Sketchfab repository, 3D models of minerals and rocks can be embedded into websites and social networks and even can be incorporated into both the textbooks or planned teaching collections, which will give students access to organized, curated collections of virtual rocks and minerals when the real samples or the laboratory classes are not available.
|
Table 2. List of the texture maps used in this study |
||||
|
Texture maps |
Metalness PBR workflow |
Specular PBR workflow |
Short description |
Software used |
|
Diffuse (also known as Albedo or Base Color) |
x |
x |
This channel defines the default texture/standard photo (images captured by the digital camera). |
Generated in Agisoft (sometimes few adjustments are needed in GIMP) |
|
Normal (or Bump) |
x |
x |
A texture to add fine surface details without increasing the number of polygons. |
xNormal or Blender |
|
Ambient Occlusion (also known as AO) |
x |
x |
A texture for self-shadowing. Usually, only diffused light is affected by ambient occlusion. |
Generated in Agisoft |
|
Opacity (also known as Transparency, Mask, or Alpha) |
x |
x |
A grayscale texture to add transparency and/or refraction. |
Blender or conventional graphic editors (e.g. GIMP) |
|
Glossiness/Roughness |
x |
x |
A grayscale texture is used to describe surface irregularities. The terms Glossiness and Roughness are interchangeable, they are simply the inverts of each other. |
|
|
Metalness |
x |
|
A texture where the metallic surfaces must be pure white and the non-metallic painted as pure black. |
|
|
Specular |
|
x |
A color map texture is used to control the amount of reflection and highlight color. |
|
Several free and commercial web services are currently available for storage and viewing 3D models (Guidazzoli et al., 2018; Rahaman et al., 2019). The increasing need for meaningful ways to display 3D models conducted also to the development of open-source and self-hosting framework solutions (e.g. 3DHOP - Potenziani et al., 2015). Guarnieri et al. (2010) describe a comprehensive workflow for presenting 3D models in the field of cultural heritage in a web-based application using only open-source software.
4. RESULTS AND DISCUSSION
To date, the Sketchfab repository of the Museum of Mineralogy and Petrography “Grigore Cobălcescu” (https://sketchfab.com/MineralogyPetrographyMuseum) consists of 450 distinct models in different thematic collections: minerals; igneous, metamorphic, and sedimentary rocks; crystal twinning; animations; crystal forms of minerals, etc. New models are added daily, and we try to cover as much as possible the whole collection of the museum (6,500 samples of rocks and minerals). The online repository has received 100,000 views in 11 months of activity and the audience is constantly growing. Furthermore, the 3D reassessment of the collection will be done not only for digital heritage perspectives but also for pedagogical and scientific purposes. Due to its kaleidoscopic and large community members, the Sketchfab platform has a great ability to increase the visibility of the project through community-oriented capabilities (i.e., comments and notification system, advanced search filters, subscribe to particular projects, etc.).
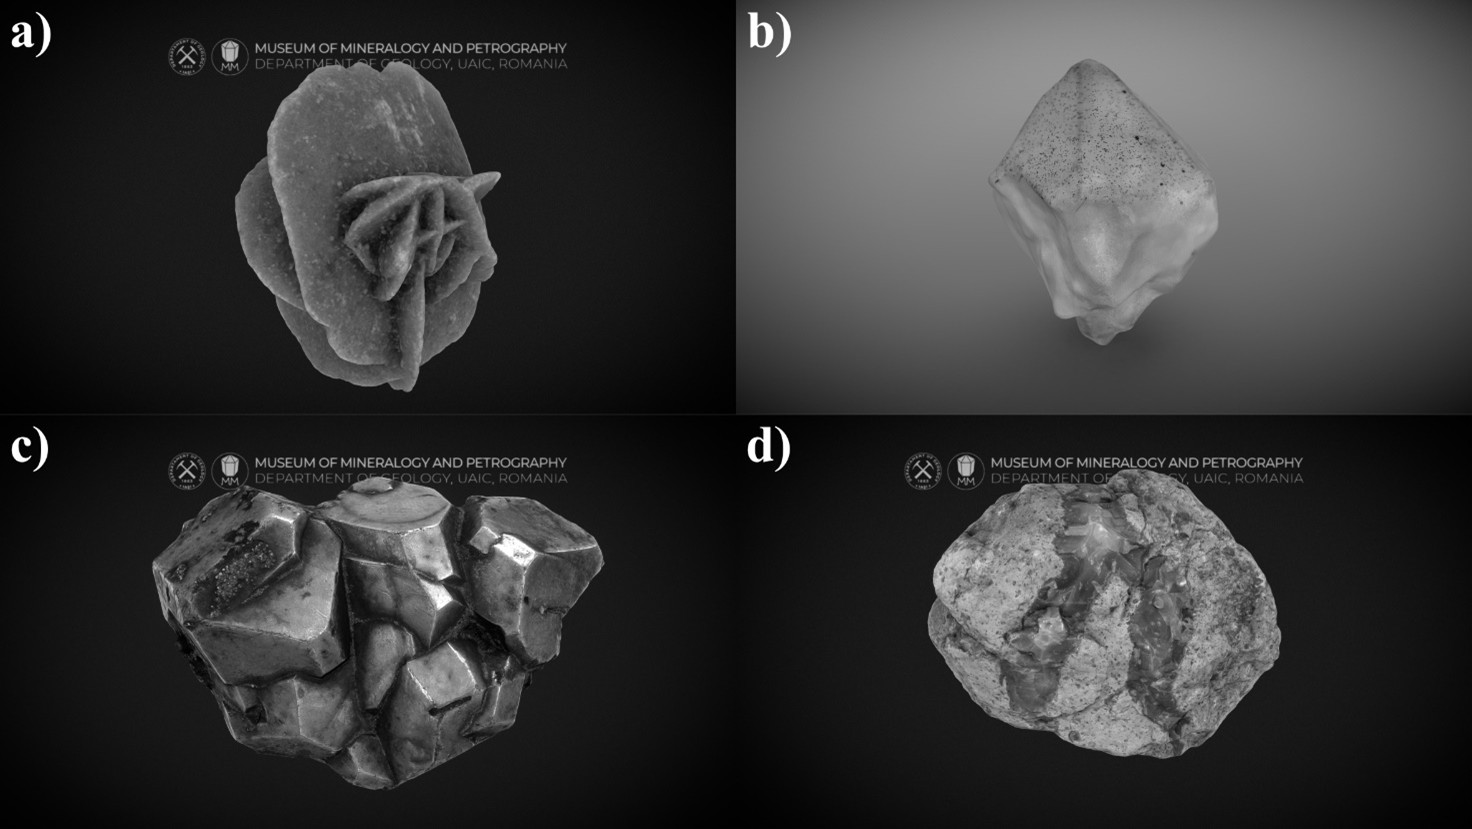
The geological collections are composed of many different samples, from opaque and nonmetallic textured minerals (Fig. 4a) to complex minerals that show optical properties and a high degree of translucency (Fig. 4b), metallic minerals (Fig. 4c), rocks with complex geometry and mineral assemblages with different optical properties (Fig. 4d). Photographing highly reflective and transparent/translucent samples (varying to several degrees) can be one of the most difficult tasks for the 3D reconstruction. Simply trying to control, modify, or remove the reflections that show up can prove to be daunting, particularly when the sample reflects everything, such as the highly reflective galena. Furthermore, the challenges of both reflective and translucent geological samples (especially the transparent ones) can be solved by using anti-reflection coating spray (i.e., coatings of different composition) in a combination with the cross-polarized light photography method. In some situations, taking into account the nature of the sample, spraying with anti-reflection coating spray is not possible. In this case, the proper lighting and cross-polarized light photography technique are enough to solve the puzzle. Moreover, specific optical properties that are seen in certain rocks and minerals (i.e., internal reflections, chatoyance, iridescence, etc.) can be addressed via post-processing steps (proper PBR texture workflow).
Moreover, in a framework in which the didactic practice is a dynamic process, prone to continuous innovation, the geological collection of the “Grigore Cobălcescu” Museum helps to innovate the teaching process within the bachelor and master programs for the disciplines in the Earth Science domains. The 3D reassessment will also involve the development of a virtual tour through the collection. The project has begun with the creation of a 3D model of the Museum and its showcases, and we will finish with the integration of mineral and rock samples (https://skfb.ly/6U7WO). The text- and image-annotations, and audio texts (or voice recordings) features improve considerably the overall experience for different thematic virtual tours. To grow popularity and to enhance the potential of the 3D models as research and teaching tools, we aim to provide complete metadata (title, description, size, etc.), keywords, links to key references, and location/locality of all samples.
Museums are changing as science and technology advance. Throughout history, geological museums have changed direction, moving towards digitalization and the creation of digital content, thus moving from a simple presentation of exhibits to one of the best educational resources which enhances the teaching-learning process and encourages the scientific vocations.
5. THE FUTURE APPLICATIONS OF 3D IN GEOSCIENCES
Three-dimensional models are becoming a necessary tool in learning, scientific and cultural heritage environments. Through 3D samples of minerals and rocks, we can merge layers of knowledge to physical objects, and share them with a broader audience.
The importance of 3D technologies has been amplified in the past few months, and online platforms like Sketchfab offer a wide range of creative possibilities: interactive experiences, virtual museum tours, virtual field trips, AR and VR, immersive digital experiences at home or in the traditional lab classes, simulation environments that we may not otherwise be able to visit or interact. Petrelli (2019) suggest that AR setting is preferred when it is possible to compare the present day with the past while VR is preferred to contextualize exhibits. Three-dimensional offers geoscientists a way of creating comprehensive and rich documentation of the real-world and sharing this documentation with the broader public. Moreover, considering the evolution of the technology industry where users have their 3D scanners in the pocket (i.e., smartphones with LiDAR sensors or ToF cameras), it is clear that new 3D technologies will mitigate some of the current limitations by learning from developments in allied disciplines. However, a three-dimensional model can never replace reality, but 3D models are invaluable in the pursuit to explore, understand, and engage with our heritage.
Earth Sciences and geological museums' main purpose is to give prominence to their collections, thus generating knowledge in different forms: scientific, technological, educational, etc. These museums contain the architecture of eternity for Earth Sciences dissemination and fundamental educational tools, besides being a source of leisure and recreation for visitors. 3D digitization is a new trend in museology that has been gaining pace very quickly, enabling researchers, students, and/or philomaths to view museum exhibits and mineralogical specimens in 3D environments on their computers or mobile devices anywhere around the globe.
The cross-polarized light technique represents an important step for future photogrammetry studies, both with pedagogic and/or scientific impact. In this respect, several cross-polarized light photogrammetry workflows not only can improve the visualization but also can open new possibilities for cultural heritage, geoscience, biological materials, medicine, forensics, etc. (e.g., difference between a replica and the original object by recording the reflective surface).
6. CONCLUSIONS AND PERSPECTIVES
In this work, we have successfully solved common limitations encountered in SfM-MVS reconstruction, where highly reflective and transparent/translucent samples can be one of the most difficult tasks for the 3D reconstruction. To overcome these limitations, the planning of the data capture, proper lighting conditions (i.e., cross-polarized light photography method, continuous and diffuse light, etc.), and post-processing steps are mandatory to improve 3D models through SfM-MVS photogrammetry. A cross-polarized light photogrammetry workflow is mandatory, at least for the minerals with metallic and submetallic luster (i.e., highly-reflective, mirror-like surface). Furthermore, the usage of anti-reflection coating spray for transparent samples represents the final solution.
The SfM-MVS workflow presented in this study can be summarized in three main components: planning, photogrammetry, and production. Data collection for all stages varies considerably (i.e., 2-8 hours/sample) depending on various factors: hardware and software used, sample complexity, post-processing, etc. The 3D reassessment of minerals and rocks is in the early stages of development. High-quality models, well-structured, contextualized contents are critical to ensure this project a useful tool for pedagogical and scientific purposes. The virtual collection is aimed to be used as teaching material for Mineralogy, Petrography, Crystallography, and other related disciplines. The geological models have long been used in learning activities, but recent developments in digital 3D modeling and visualization methodologies may revolutionize not only teaching and learning but also the research process in Geosciences. These technologies have a huge potential in this field.
The three-dimensional reconstruction presented in this study illustrate three main aspects of the geological museum activities: conservation management, learning and scientific environments, and dissemination. Future plans consist of an increase in the number of digitized collections, and also a diversification of geological samples (i.e., fossils, outcrops, etc.).
REFERENCES
- Agisoft, L., 2020. Agisoft Metashape (https://www.agisoft.com). St. Petersburg, Russia.
- Andrews, G.D.M., Labishak, G.D., Brown, S.R., Isom, S.L., Pettus, H.D., Byers, T., 2020. Teaching with Digital 3D Models of Minerals and Rocks. GSA Today 30, 42–43.
- Betlem, P., Birchall, T., Ogata, K., Park, J., Skurtveit, E., Senger, K., 2020. Digital Drill Core Models: Structure-from-Motion as a Tool for the Characterisation, Orientation, and Digital Archiving of Drill Core Samples. Remote Sens. 12, 330.
- Brecko, J., Mathys, A., Dekoninck, W., Leponce, M., VandenSpiegel, D., Semal, P., 2014. Focus stacking: Comparing commercial top-end set-ups with a semi-automatic low budget approach. A possible solution for mass digitization of type specimens. Zookeys 464, 1–23.
- Bruno, F., Bruno, S., De Sensi, G., Luchi, M.-L., Mancuso, S., Muzzupappa, M., 2010. From 3D reconstruction to virtual reality: A complete methodology for digital archaeological exhibition. J. Cult. Herit. 11, 42–49.
- Buzgar, N., Apopei, A.I., Diaconu, V., Buzatu, A., 2013. The composition and source of the raw material of two stone axes of Late Bronze Age from Neamt County (Romania)-A Raman study. Analele Stiint. Univ. AI Cuza din Iasi. Sect. 2, Geol. 59, 5.
- Caravaca, G., Le Mouélic, S., Mangold, N., L’Haridon, J., Le Deit, L., Massé, M., 2020. 3D digital outcrop model reconstruction of the Kimberley outcrop (Gale crater, Mars) and its integration into Virtual Reality for simulated geological analysis. Planet. Space Sci. 182, 104808.
- Carrivick, J.L., Smith, M.W., Quincey, D.J., 2016. Structure from Motion in the Geosciences, Structure from Motion in the Geosciences. John Wiley & Sons, Ltd, Chichester, UK.
- Carrozzino, M., Bergamasco, M., 2010. Beyond virtual museums: Experiencing immersive virtual reality in real museums. J. Cult. Herit. 11, 452–458.
- Cawood, A., Bond, C., 2019. eRock: An Open-Access Repository of Virtual Outcrops for Geoscience Education. GSA Today 29, 36–37.
- Champion, E., Rahaman, H., 2019. 3D Digital Heritage Models as Sustainable Scholarly Resources. Sustainability 11, 2425.
- Chang, S.C., Hsu, T.C., Jong, M.S.Y., 2020. Integration of the peer assessment approach with a virtual reality design system for learning earth science. Comput. Educ. 146, 103758.
- Cho, Y., Clary, R.M., 2020. Challenges and Opportunities for Virtual Learning in College Geology, in: Active Learning in College Science. Springer International Publishing, Cham, pp. 713–728.
- De Paor, D.G., 2016. Virtual Rocks. GSA Today 26, 4–11.
- De Reu, J., Plets, G., Verhoeven, G., De Smedt, P., Bats, M., Cherretté, B., De Maeyer, W., Deconynck, J., Herremans, D., Laloo, P., Van Meirvenne, M., De Clercq, W., 2013. Towards a three-dimensional cost-effective registration of the archaeological heritage. J. Archaeol. Sci. 40, 1108–1121.
- Dumitriu, T.-C., Balan, I.-V., 2017. 3-D minerals. Auxiliary material for the Physical Geology classes. Analele Stiint. Univ. AI Cuza din Iasi. Sect. 2, Geol. 63, 25–35.
- Dumitriu, T.-C., Loghin, S., Brânzilă, M., Baciu, D.S., Dumitriu, S.D., Mare, S., Dumitriu, A.M., Ionesi, V., 2021. Microscopic “Structure-from-Motion” Photogrammetry, a method for microfossil study. Carpathian J. Earth Environ. Sci. 16, 93–98.
- Erolin, C., Jarron, M., Csetenyi, L.J., 2017. Zoology 3D: Creating a digital collection of specimens from the D′Arcy Thompson Zoology Museum. Digit. Appl. Archaeol. Cult. Herit. 7, 51–55.
- Eulitz, M., Reiss, G., 2015. 3D reconstruction of SEM images by use of optical photogrammetry software. J. Struct. Biol. 191, 190–196.
- Ferdani, D., Fanini, B., Piccioli, M.C., Carboni, F., Vigliarolo, P., 2020. 3D reconstruction and validation of historical background for immersive VR applications and games: The case study of the Forum of Augustus in Rome. J. Cult. Herit. 43, 129–143.
- Flynn, T., 2019. What Happens When You Share 3D Models Online (In 3D)?. 3D/VR Acad. Libr. Emerg. Pract. Trends, ed. Jennifer Grayburn, Zack Lischer-Katz, Kristina Golubiewski-Davis, Veronica Ikeshoji-Orlati (Council Libr. Inf. Resour. 2019) 73–86.
- Gallo, A., Muzzupappa, M., Bruno, F., 2014. 3D reconstruction of small sized objects from a sequence of multi-focused images. J. Cult. Herit. 15, 173–182.
- Guarnieri, A., Pirotti, F., Vettore, A., 2010. Cultural heritage interactive 3D models on the web: An approach using open source and free software. J. Cult. Herit. 11, 350–353.
- Guidazzoli, A., Liguori, M.C., Chiavarini, B., Verri, L., Imboden, S., De Luca, D., Delli Ponti, F., 2018. From 3D Web to VR historical scenarios: A cross-media digital heritage application for audience development, in: Proceedings of the 2017 23rd International Conference on Virtual Systems and Multimedia, VSMM 2017. IEEE, pp. 1–8.
- Hasiuk, F., 2014. Making things geological: 3-D printing in the geosciences. GSA Today 24, 28–29.
- Heritage, G.L., Hetherington, D., 2007. Towards a protocol for laser scanning in fluvial geomorphology. Earth Surf. Process. Landforms 32, 66–74.
- Hodge, R., Brasington, J., Richards, K., 2009. Analysing laser-scanned digital terrain models of gravel bed surfaces: Linking morphology to sediment transport processes and hydraulics. Sedimentology 56, 2024–2043.
- Longuet-Higgins, H.C., 1981. A computer algorithm for reconstructing a scene from two projections. Nature 293, 133–135.
- Lowe, D.G., 2004. Distinctive image features from scale-invariant keypoints. Int. J. Comput. Vis. 60, 91–110.
- McDermott, W., 2018. The PBR Guide by Allegorithmic. Allegorithmic.
- Meza, J., Marrugo, A.G., Ospina, G., Guerrero, M., Romero, L.A., 2019. A Structure-from-Motion Pipeline for Generating Digital Elevation Models for Surface-Runoff Analysis. J. Phys. Conf. Ser. 1247, 012039.
- Micheletti, N., Chandler, J.H., Lane, S.N., 2015. Structure from motion (SfM) photogrammetry: British Society for Geomorphology Geomorphological Techniques. Online Ed. (ISSN 2047-0371).
- Milosz, M., Skulimowski, S., Kęsik, J., Montusiewicz, J., 2020. Virtual and interactive museum of archaeological artefacts from Afrasiyab – An ancient city on the silk road. Digit. Appl. Archaeol. Cult. Herit. 18, e00155.
- Nikolov, I., Madsen, C., 2016. Benchmarking close-range structure from motion 3D reconstruction software under varying capturing conditions, in: Lecture Notes in Computer Science (Including Subseries Lecture Notes in Artificial Intelligence and Lecture Notes in Bioinformatics). Springer Verlag, pp. 15–26.
- Perkins, D., Stene, N., Schultz, A., Bentley, C., Hollister, R.J., 2019. Rocks and Minerals -- a Library of 3-Dimensional Images for Classroom Use, in: GSA Annual Meeting in Phoenix, Arizona, USA-2019.
- Petrelli, D., 2019. Making virtual reconstructions part of the visit: An exploratory study. Digit. Appl. Archaeol. Cult. Herit. 15, e00123.
- Potenziani, M., Callieri, M., Dellepiane, M., Corsini, M., Ponchio, F., Scopigno, R., 2015. 3DHOP: 3D Heritage Online Presenter. Comput. Graph. 52, 129–141.
- Rahaman, H., Champion, E., 2019. To 3D or Not 3D: Choosing a Photogrammetry Workflow for Cultural Heritage Groups. Heritage 2, 1835–1851.
- Rahaman, H., Champion, E., Bekele, M., 2019. From photo to 3D to mixed reality: A complete workflow for cultural heritage visualisation and experience. Digit. Appl. Archaeol. Cult. Herit. 13.
- Riquelme, A., Cano, M., Tomás, R., Jordá, L., Pastor, J.L., Benavente, D., 2019. Digital 3D Rocks: A Collaborative Benchmark for Learning Rocks Recognition. Rock Mech. Rock Eng. 52, 4799–4806.
- Schaefer, M., Inkpen, R., 2010. Towards a protocol for laser scanning of rock surfaces. Earth Surf. Process. Landforms 35, 147–423.
- Schemm-Gregory, M., Henriques, M.H., 2013. The Devonian Brachiopod Collections of Portugal-a Palaeontological Heritage. Geoheritage 5, 107–122.
- Seitz, S.M., Curless, B., Diebel, J., Scharstein, D., Szeliski, R., 2006. A comparison and evaluation of multi-view stereo reconstruction algorithms, in: Proceedings of the IEEE Computer Society Conference on Computer Vision and Pattern Recognition. IEEE, pp. 519–526.
- Smith, M.W., Carrivick, J.L., Quincey, D.J., 2016. Structure from motion photogrammetry in physical geography. Prog. Phys. Geogr. Earth Environ. 40, 247–275.
- Svennevig, K., Guarnieri, P., Stemmerik, L., 2015. From oblique photogrammetry to a 3D model – Structural modeling of Kilen, eastern North Greenland. Comput. Geosci. 83, 120–126.
- Ullman, S., 1979. The interpretation of structure from motion.. Proc. R. Soc. Lond. B. Biol. Sci. 203, 405–426.
- UNESCO, 2020. COVID-19 Educational Disruption and Response [WWW Document]. Unesco.Org. URL https://en.unesco.org/covid19/educationresponse
- Vanneschi, Camillo, Aiello, Bonciani, Salvini, 2019. SfM-MVS Photogrammetry for Rockfall Analysis and Hazard Assessment Along the Ancient Roman Via Flaminia Road at the Furlo Gorge (Italy). ISPRS Int. J. Geo-Information 8, 325.
- Wajs, J., 2015. Research on surveying technology applied for dtm modelling and volume computation in open pit mines. Min. Sci. 22, 75–83.
- Westoby, M.J., Brasington, J., Glasser, N.F., Hambrey, M.J., Reynolds, J.M., 2012. “Structure-from-Motion” photogrammetry: A low-cost, effective tool for geoscience applications. Geomorphology 179, 300–314.
- Young, E.J., 2012. Section 2.1.3: dGPS., in: Cook, S.J., Clarke, L.E. & Nield, J.M. (Ed.), Geomorphological Techniques (Online Edition). British Society for Geomorphology; London, UK. ISSN: 2047-0371.