
1. INTRODUCTION
Montado landscapes in Portugal are high nature value agro-silvo-pastoral systems characterized by low-density tree canopy dominated by Holm oak (Quercus suber) and Cork Oaks (Quercus rotundifolia) (Muñoz-Rojas et al., 2019), encompassing multiple ecosystem services. Currently, there is a continuous decrease in montado (Pinto-Correia & Godinho, 2013) and a reduction in natural tree regeneration (Muñoz-Rojas et al., 2019) as they face climate change, management transformations, local knowledge crisis, and social uncertainty (Lopes-Fernandes et al., 2024; Muñoz-Rojas et al., 2019). Soil health is a key determinant of ecosystem resilience and productivity in Mediterranean agro-silvo-pastoral systems. Haplic Arenosols - the predominant soils in the region (Mendes & Costa, 2015), are very sandy soils with low water-holding capacity (Carreira et al., 2023).
The poor soil and water limitations during the summer season lead to a decrease in groundwater levels (Carreira et al., 2023), which respond quickly to rainfall (Mendes & Costa, 2015). The occurrence of tree decline in the past is also associated with soil characteristics that interfere with root expansion and water retention (Sá-Sousa, 2014). Research on understory confirmed that drought can cause a co-limitation of water and nitrogen, thereby affecting productivity (Jongen et al., 2013). The detected reduction in tree density, which in turn leads to larger openings in the montado land cover (Muñoz-Rojas et al., 2019), along with the findings that soil temperature values outside the canopy shelter are generally higher and that the decrease in soil water content is more rapid (Nunes et al., 2011), additionally increases the importance of knowledge on soil moisture variation. A feedback loop connecting soil organic matter depletion, overgrazing (Simionesei et al., 2018), and climate change is determined as one of the key disturbances in the complex montado socio-ecological system (SES) (Pinto-Correia et al., 2011). The importance of soil degradation processes and the efforts of farmers for soil health management were acknowledged by Winkler & Pinto-Correia (2026). Observations on soil moisture content using proximal sensors have given important information for montado managers (Nunes et al., 2011; Serrano et al., 2018). Soil moisture from multi-temporal Landsat images has been shown to be valuable for monitoring agricultural drought (Saha et al., 2018). Given the changes that the montado is undergoing and the dynamics of climate-driven disturbances that have been shown to deeply affect the resilience of this complex ecosystem, the present research looks for further insights focusing on the effect of soil moisture regimes on soil-related processes. The study is focused on Companhia das Lezírias, a long-term research site within the LTsER Montado platform, part of the European eLTER network.
The objective of the study is to investigate existing soil moisture patterns to soil parameters, focusing on carbon stocks, and relate them to information derived from remote sensing data by mapping moisture regimes and detecting soil hotspots. This study tests the hypotheses that soil moisture regimes and carbon accumulation are closely linked in montado ecosystems, resulting in persistent spatial patterns. The results from the study aim to contribute to the collected scientific knowledge on the effect of drought on soil health and to support montado managers in their efforts to maintain montado resilience while preserving its productivity.
2. MATERIALS AND METHODS
The investigation was conducted in Companhia das Lezírias, an agro-silvo-pastoral system situated in south-west Portugal, close to Lisbon – one of the largest agroforestry companies managing over 19500 ha of land, 8840 of which are forests (Quercus suber, Pinus pinaster, Pinus pinea, Eucalyptus globulus) (Alves et al., 2020).
2.1. Preparation phase
To identify suitable plots for soil sampling, an initial GIS analysis was conducted to delineate areas characterized by contrasting moisture indicators. For this purpose, the Soil Moisture Index (SMI) was calculated based on Landsat 8-9 OLI/TIRS C2 L1 datasets, Band 10 (wavelength 10.6-11.19 micrometers), resolution 100 (resampled to 30) for the years 2017, 2019, 2021, and 2023 for the end of September, focusing on end-of-summer periods to capture peak moisture deficits. Images with cloud cover of less than 6% were used.
The calculations were based on Land Surface Temperature and emissivity (Saha et al., 2018; Todorova & Zhiyanski, 2025) and were performed using Raster Calculator in ArcGIS Pro 3.2.0. The indices for the 4 years were integrated using the Cell Statistics tool in ArcGIS Pro with the mean function so that results could be accumulated and less dependent on short-term variations. This approach produced a raster representing persistent spatial patterns in soil moisture by averaging annual SMI values at the pixel level. It is important to note that the index is calculated for the end-of-summer period, when green grass cover is largely absent.
Using the index for that period helps capture peak soil moisture deficit and identify persistent dry hotspots and areas vulnerable to drought stress. The results for SMI were classified into 5 classes using Jenks Natural Breaks (Jenks, 1967). Thereafter, the classes were intersected to identify areas with values of SMI that are persistently low/medium/high for all 4 years (Todorova & Zhiyanski, 2023). The results were then aligned with the land use, and the areas were selected only for cork oak forests. Areas with polar and medium values in cork oak forests were selected as sampling plots.
2.2. Sampling and Laboratory Analyses
In the period 23-26 September 2024, 13 sampling plots were visited, and soil samples were taken from 3 depths (0–10, 10–20, and 20–30 cm) in three microsites (below canopy- 2 meters away from a tree trunk, in the open, and between trees) – 117 samples in total. The samples were collected using a soil auger of known cylinder volume. The cores were carefully extracted to minimize soil disturbance and compaction. After collection, each sample was transferred to a separate, appropriately labelled container/bag and transported to the laboratory. The samples were tested in the Laboratory of the Forest Research Institute – Bulgarian Academy of Sciences. In accordance with ISO 11465:1993, soil samples were oven-dried at 105 °C for 5 h to determine soil moisture content (W) and bulk density (BD). Chemical analyses were performed on sieved samples (<2 mm) to determine soil organic carbon (SOC) and SOC stock (SOC stock), total nitrogen (TN) and TN stock (TN stock).
2.3. Spatial Data Analysis
The results were related to soil moisture index data extracted from images from 2024 (the year of the sampling) to find correlations between the moisture variations and the soil properties, looking for temporal patterns rather than direct short-term responses.
The calculations, also used in Todorova & Zhiyanski (2025) based on the combination of NDVI and LST and introduced by Sandholt et al. (2002) are:

where, LSTmax /LSTmin – represent the maximum and minimum surface temperature; LST – refers to the land surface temperature.
LST is calculated following Artis & Carnahan (1982):

where, Tb (in °C) is the satellite brightness temperature; α is the wavelength of emitted radiance; C2 is a constant (1.4388); and 𝜀 is the emissivity of the surface.
The satellite brightness temperature Tb is derived from:

where, 𝐾1 is sensor-dependent calibration constant 1 (774.8853) and 𝐾2 is sensor-dependent calibration constant 2 (1321.0789); L is Top of Atmosphere (TOA) spectral radiance; 𝑃𝑣 (5); and CV is the correction value for Landsat Images (0.986).

where, Pv is the fractional vegetation cover, computed as:

where, CV is a correction value for Landsat images (typically 0.986); NDVI is defined as the ratio of reflectivity differences between NIR and the Red band to their sum; NDVI is calculated after Rouse et al. (1974):

where, NIR is the reflectance in the near-infrared band (Band 5), and Red is the reflectance in the red band (Band 4).
The result values range from 0 to 1, where values near 1 indicate a higher level of soil moisture and values near 0 indicate a lower level of soil moisture. All the calculations are carried out using the Raster Calculator in ArcGIS Pro 3.2.0, ESRI Inc., 2023.
After the sampling, SMI was also calculated for 2024, the year of the sampling, for each month from June to September. The values of SMI at the exact same points of the samples were correlated with the laboratory data on SOC, TN, and their ratio. The results were analysed against the data from the laboratory analyses using Pearson correlation to assess the pattern of soil moisture intensity over time and explore its connection to soil characteristics. The values of carbon stock were interpolated to reveal spatial patterns (Todorova & Zhiyanski, 2023) using the kriging technique (ordinary kriging with a spherical semivariogram model). To have a representation of persistent moisture patterns, average SMI for 2017–2024 was calculated using Cell Statistics in ArcGIS Pro.
3. RESULTS AND DISCUSSION
The SMI values range, the lowest starting from 0.006 in 2019 to highest reaching 0.901 in 2017. The driest year within that period was 2019.
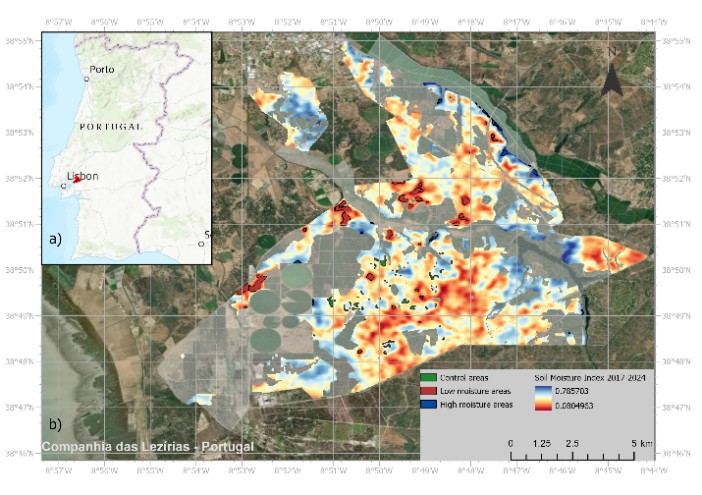
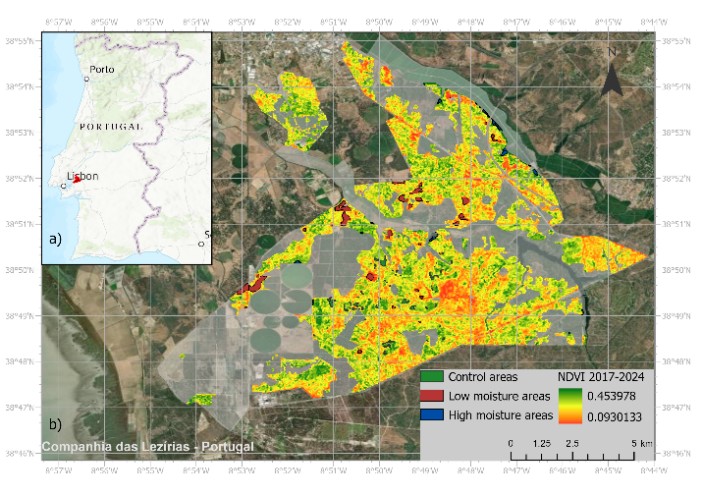
The soil moisture pattern derived from satellite data based on the mean value of SMI for the period 2017-2024 shows a high degree of spatial consistency. The calculation procedure, based on the relationship between LST and the NDVI, systematically identifies open areas with sparse vegetation as zones of lower soil moisture. The identification of persistent dry hotspots is particularly relevant in the context of increasing frequency and intensity of drought events in Mediterranean regions (IPCC, 2021). In sandy Haplic Arenosols with low water-holding capacity, drought impacts are amplified, as reported by Carreira et al. (2023). The spatial distribution of soil moisture within the montado forests in – Companhia das Lezírias reveals a pattern of more moisture in the northeast and southwest parts of the area and less in the south and central parts (Figure 1a-b). NDVI mean values logically correspond to the spatial distribution of SMI (Figure 2a-b).
The results from Pearson correlation between the laboratory analysis of the soil samples and the SMI values for the same locations at the time of the sampling and 4 previous months prior to the sampling reveal moderate to relatively strong relationships for organic carbon stock and carbon content, while nitrogen stock and content show weak correlation (Table 1). Soil represents a major reservoir of carbon, with land use influencing carbon sequestration or environmental degradation (Păltineanu et al., 2025). In montado forests more than 88% of the organic carbon was found within the first 40 cm of the soil profile in montado ecosystems (Oubrahim et al., 2015). Ikraoun et al. (2024) also confirm the important role of soil as a carbon reservoir in cork oak forests in Morocco. Soil moisture directly influences soil microbial activity and soil organic matter decomposition, with optimal moisture conditions enhancing these processes and increasing carbon sequestration (Hao et al., 2025).
The strongest relationships were observed in the 20-30 cm soil layer for carbon-related parameters, particularly for SOC stock and C/N ratios with higher correlations observed in September and June SMI values.
Surface soil layers (0-10 cm) show more persistent correlations between carbon-related parameters and SMI values. The correlation shows the highest values with SMI in August and July. In contrast, nitrogen parameters exhibited weak or negative correlations with SMI across all depths. This could reflect the more dynamic nature of nitrogen cycling, which is strongly controlled by microbial activity, mineralization processes, and plant uptake rather than by short-term soil moisture variability alone (Booth et al., 2005).
|
Table 1. Correlation between soil parameters and soil moisture values for the period prior sampling. The p-value is p<0.05 (p≈0.019). |
||||
|
SMI in September 2024 |
SMI in August 2024 |
SMI in July 2024 |
SMI in June 2024 |
|
|
C% |
0.27 |
0.37 |
0.33 |
0.22 |
|
N% |
0.00 |
0.18 |
0.11 |
0.11 |
|
C/N |
0.35 |
0.34 |
0.27 |
0.13 |
|
SOC stock, tC/ha |
0.24 |
0.41 |
0.28 |
0.17 |
|
TN stock, tNha |
-0.07 |
0.27 |
0.05 |
0.06 |
|
C% (10-20 cm) |
0.07 |
0.18 |
0.10 |
-0.02 |
|
N% (10-20 cm) |
-0.04 |
0.01 |
0.01 |
-0.04 |
|
C/N (10-20 cm) |
-0.10 |
-0.04 |
-0.11 |
-0.18 |
|
SOC stock, tC/ha (10-20 cm) |
0.00 |
0.09 |
0.01 |
-0.11 |
|
TN stock, tNha (10-20 cm) |
-0.18 |
-0.16 |
-0.15 |
-0.19 |
|
C% (20-30cm) |
0.42 |
0.33 |
0.27 |
0.42 |
|
N% (20-30cm) |
0.12 |
-0.02 |
0.36 |
0.12 |
|
C/N (20-30cm) |
0.51 |
0.07 |
-0.01 |
0.34 |
|
SOC stock, tC/ha (20-30cm) |
0.39 |
0.32 |
0.26 |
0.39 |
|
TN stock, tNha (20- 30 cm) |
0.00 |
0.05 |
0.02 |
0.00 |
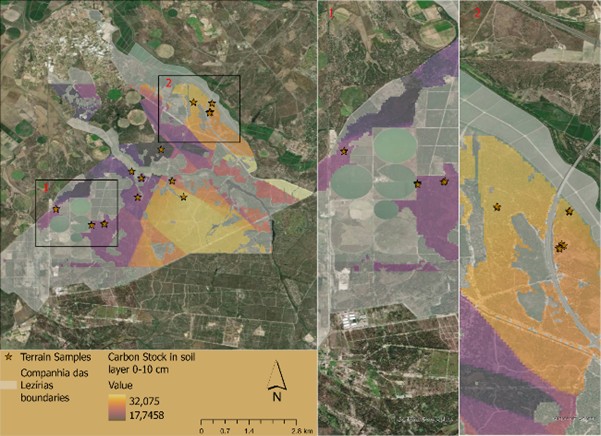
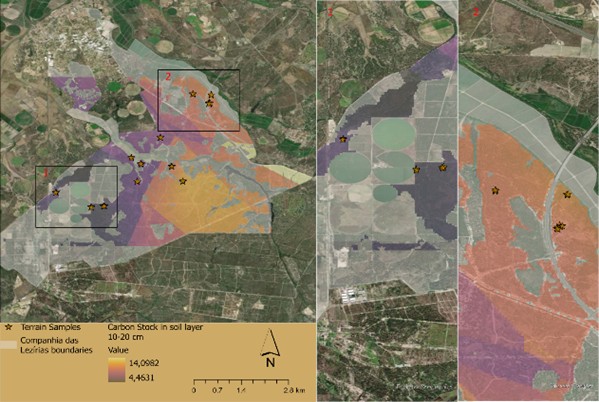
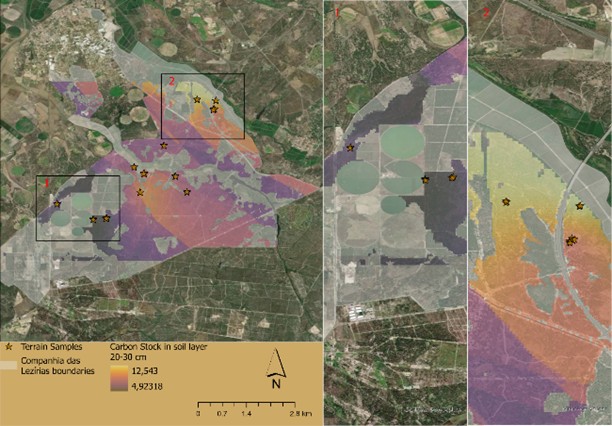
To evaluate landscape-scale patterns, the spatial distribution of soil carbon stocks within montado land-use areas was generated through kriging interpolation of the laboratory-derived soil sample data. The carbon stock distribution pattern was investigated based on interpolation of the three soil depth layers: 0-10 cm; 10-20 cm; 20-30 cm (Figure 3a-c).
The results reveal pronounced spatial differentiation across the Companhia das Lezírias study area. While the central area displays heterogeneous patterns, the northeastern sector consistently functions as a carbon-rich hotspot across all three soil layers, whereas the southwestern sector represents a persistent carbon-poor zone. This spatial pattern partially corresponds to the soil moisture regime indicated by the average SMI for 2017-2024.
In line with this, the persistent soil moisture distribution identified in our study is associated with spatial differences in soil carbon stocks across the study area. The temporal patterns observed for carbon stocks, with stronger correlations to July–August moisture conditions, suggest that wetter locations accumulate more carbon over long periods.
It should be noted that SOC stocks represent relatively stable soil properties that change slowly over time. Therefore, correlations with monthly SMI values should be interpreted primarily as spatial and temporal relationships between soil moisture conditions and carbon distribution rather than as direct short-term temporal responses. Carbon stocks in the topsoil layer (0-10 cm) vary from 17.7 to 32t/ha, whereas the stocks in the deeper layers range from 4.9 to 12.5 t/ha in the 20-30 cm layer.
Integrating Landsat-derived SMI with laboratory soil analyses offers a scalable approach for monitoring ecosystem health and supporting adaptive management, as demonstrated by Saha et al. (2018) for agricultural drought monitoring.
4. CONCLUSIONS
Although neither the correlations nor the patterns reveal clear and straightforward relations, the study advances understanding of the natural processes controlling soil carbon distribution and accumulation, as well as their link to moisture dynamics in an environment with strong anthropogenic presence.
The results from the present study indicate a spatial correspondence between persistent soil moisture patterns and the spatial differentiation of soil carbon stocks, suggesting a potential relationship between soil moisture conditions and soil carbon dynamics in montado ecosystems. Although soil carbon stocks are influenced by multiple factors not explicitly considered here, including local differences in grazing intensity and other management practices, the study area is consistently characterized by montado land use. The observed correspondence therefore suggests that soil moisture persistence may be one of the factors contributing to the spatial variability of soil carbon stocks. The interaction between declining tree density, soil moisture loss, and carbon depletion may create reinforcing feedbacks that threaten system resilience. The spatial consistency of dry zones observed in the study area suggests structural vulnerability rather than short-term variability, highlighting areas where management interventions may be particularly important. Such feedbacks imply socio-ecological trap dynamics, where environmental degradation and management constraints reinforce each other, leading to persistent unsustainable system states. Addressing these risks may require integrated management strategies combining canopy restoration, soil conservation, and water retention measures. Our hypothesis was only partially confirmed, as soil moisture patterns were associated with variations in carbon stocks, but the observed correlations were moderate and not consistent across all depths. Nitrogen-related parameters showed weaker and more variable correlations. Future research integrating the role of other factors, such as microbial activity, soil texture, grazing, management practices and including longer-term monitoring, more frequent soil moisture measurements, and modelling approaches could capture the complex interactions between hydrology, biogeochemistry, and carbon storage in montado ecosystems.
Remote sensing proved to be an effective tool for identifying drought-prone zones and guiding targeted field sampling. The use of multi-temporal SMI enabled the identification of persistent soil moisture regimes, while kriging interpolation revealed spatial distribution patterns of soil carbon stocks. This integrated approach provides a robust framework for monitoring climate-related impacts in agroforestry systems and supports evidence-based management decisions.
ACKNOWLEDGMENT
The study was carried out under the project “Soil Health and Management in montado forests under ecological drought” financed by eLTER PLUS D7.1, Transnational and Remote Access Scheme and by the LTER-BG infrastructure (Agreement No. DО1-320/30.11.2023), purchased under the National Roadmap for Research Infrastructure, financially coordinated by the Ministry of Education and Science”.
REFERENCES
- Alves, R., Alcobia, S., do Rosário, I. T., Roque, I., Simões, J., & Santos-Reis, M., 2020. Companhia das Lezírias: Towards sustainable forest management. Companhia das Lezírias, S.A.; cE3c; ICAAM.
- Artis, D.A., & Carnahan, W.H., 1982. Survey of emissivity variability in thermography of urban areas. Remote Sensing of Environment, 12(4), 313–329.
- Booth, M.S., Stark, J.M., & Rastetter, E., 2005. Controls on nitrogen cycling in terrestrial ecosystems: A synthetic analysis of literature data. Ecological Monographs, 75(2), 139–157. https://doi.org/10.1890/04-0988
- Carreira, E., Serrano, J., Lopes de Castro, J., Shahidian, S., & Pereira, A.F., 2023. Montado Mediterranean ecosystem (soil–pasture–tree and animals): A review of monitoring technologies and grazing systems. Applied Sciences, 13, 6242. https://doi.org/10.3390/app13106242
- Hao, Y., Mao, J., Bachmann, C.M., Hoffman, F.M., Koren, G., Chen, H., Tian, H., Liu, J., Tao, J., Tang, J., Li, L., Liu, L., Apple, M., Shi, M., Jin, M., Zhu, Q., Kannenberg, S., Shi, X., Zhang, X., Wang, Y., Fang, Y., & Dai, Y., 2025. Soil moisture controls over carbon sequestration and greenhouse gas emissions: A review. npj Climate and Atmospheric Science, 8, Article 16.
- Ikraoun, H., El Mderssa, M., Aliyat, F. Z., Nassiri, L., & Ibijbijen, J., 2024. Assessing carbon storage and biomass in Moroccan cork oak forests. Ecological Engineering & Environmental Technology, 25(6), 43–53. https://doi.org/10.12912/27197050/186550
- IPCC, 2021. Climate change 2021: The physical science basis. Contribution of Working Group I to the Sixth Assessment Report of the Intergovernmental Panel on Climate Change. Cambridge University Press.
- Jenks, G.F., 1967. The data model concept in statistical mapping. International Yearbook of Cartography, 7, 186–190.
- Jongen, M., Unger, S., Fangueiro, D., Cerasoli, S., Silva, J.M.N., & Pereira, J.S., 2013. Resilience of montado understorey to experimental precipitation variability fails under severe natural drought. Agriculture, Ecosystems & Environment, 178, 18–30. https://doi.org/10.1016/j.agee.2013.06.014
- Lopes-Fernandes, M., Martínez-Fernández, E., Alves, R., Boa-Nova, D., Branquinho, C., Bugalho, M.N., Campos-Mardones, F., Coca-Pérez, A., Frazão-Moreira, A., Marques, M., Moreno-Ortiz, J., Paulo, O., Príncipe, A., Quintero, V., Sendim, A., Sobral, H., & Escalera-Reyes, J., 2024. Cork oak woodlands and decline: A social-ecological review and future transdisciplinary approaches. Agroforestry Systems, 98, 1927–1944. https://doi.org/10.1007/s10457-024-00999-4
- Mendes, M.P., & Costa, A., 2015. Climate effects on stem radial growth of Quercus suber L.: Does tree size matter? Forestry: An International Journal of Forest Research, 88(5), 589–598. https://doi.org/10.1093/forestry/cpv034
- Muñoz-Rojas, J., Pinto-Correia, T., Thorsoe, M.H., & Noe, E., 2019. The Portuguese Montado: A complex system under tension between different land use management paradigms. IntechOpen. https://doi.org/10.5772/intechopen.86102
- Nunes, J., Andrade, J., Abreu, F., Gazarini, L., & Madeira, M., 2011. Microclimatic specificity of a Mediterranean oak woodland (montado) in context of global change. Folia Oecologica, 38, 96–103.
- Oubrahim, H., Boulmane, M., Bakker, M.R., Augusto, L., & Halim, M., 2015. Carbon storage in degraded cork oak (Quercus suber) forests on flat lowlands in Morocco. iForest, 9, 125–137. https://doi.org/10.3832/ifor1364-008
- Paltineanu, C., Mocanu, V., Dumitru, S., & Domnariu, H., 2025. Soil functions depending on soil indicators in various environments and land uses – A case study of Romania. Carpathian Journal of Earth and Environmental Sciences, 20(1), 27–46. https://doi.org/10.26471/cjees/2025/020/311
- Pinto-Correia, T., & Godinho, S., 2013. Changing agriculture – changing landscapes: What is going on in the high valued Montado. In Agriculture in Mediterranean Europe: Between old and new paradigms (Vol. 19, pp. 75–90). Emerald Group Publishing. https://doi.org/10.1108/S1057-1922(2013)0000019006
- Pinto-Correia, T., Ribeiro, N., & Sá Sousa, P., 2011. Introducing the montado, the cork and holm oak agroforestry system of Southern Portugal. Agroforestry Systems, 82(2), 99–104. https://doi.org/10.1007/s10457-011-9388-1
- Rouse, J.W., Haas, R.H., Schell, J.A., & Deering, D.W., 1974. Monitoring vegetation systems in the Great Plains with ERTS. In Proceedings of the Third Earth Resources Technology Satellite-1 Symposium, NASA SP-351, Vol. 1, 309–317.
- Sá-Sousa, P., 2014. The Portuguese montado: Conciliating ecological values with human demands within a dynamic agroforestry system. Annals of Forest Science, 71(1), 1–3. https://doi.org/10.1007/s13595-013-0338-0
- Saha, A., Patil, M., Goyal, V.C., & Rathore, D.S., 2018. Assessment and impact of soil moisture index in agricultural drought estimation using remote sensing and GIS techniques. In Proceedings of the 3rd International Electronic Conference on Water Sciences (ECWS-3). https://doi.org/10.3390/ecws-3-05724
- Sandholt, I., Rasmussen, K., & Andersen, J., 2002. A simple interpretation of the surface temperature/vegetation index space for assessment of surface moisture status. Remote Sensing of Environment, 79(2–3), 213–224. https://doi.org/10.1016/S0034-4257(01)00274-7
- Serrano, J., Shahidian, S., Marques da Silva, J., & de Carvalho, M., 2018. A holistic approach to the evaluation of the Montado ecosystem using proximal sensors. Sensors, 18(2), Article 570. https://doi.org/10.3390/s18020570
- Simionesei, L., Ramos, T.B., Oliveira, A.R., Jongen, M., Darouich, H., Weber, K., Proença, V., Domingos, T., & Neves, R., 2018. Modeling soil water dynamics and pasture growth in the montado ecosystem using MOHID Land. Water, 10(4), 489.
- Todorova, E., & Zhiyanski, M., 2023. Study on soil quality in different functional zones of Sofia region. One Ecosystem, 8. https://doi.org/10.3897/oneeco.8.e101381
- Todorova, E., & Zhiyanski, M., 2025. Spatial and temporal exploration of NDVI, LAI, and SMI in coniferous forests: Detecting changes in Parangalitsa Reserve. Journal of the Bulgarian Geographical Society, 52, 59–78. https://doi.org/10.3897/jbgs.e140222
- Winkler, G., & Pinto-Correia, T., 2026. Unveiling soil stewardship: Plural values in the management of the Montado agro-silvo-pastoral system in Portugal. Land Use Policy, 160, Article 107835. https://doi.org/10.1016/j.landusepol.2025.107835