1. INTRODUCTION
Metals enter aquatic environments through both natural and anthropogenic processes. Natural sources include rock weathering, soil erosion, volcanic activity, and atmospheric deposition, whereas human-derived inputs arise from mining, fossil fuel combustion, agricultural practices, boating activities, and the discharge of municipal and industrial wastes (Yorulmaz et al., 2015). Unlike many organic pollutants, metals are not degraded biologically or chemically and can persist in aquatic systems for long periods (Rether, 2002). Once introduced into rivers, lakes, and coastal waters, they may be transported in dissolved form or adsorbed onto suspended particles and sediments, where they can accumulate and remain available for remobilization under changing environmental conditions (Tessier et al., 2011).
Some metals, including iron (Fe), copper (Cu), manganese (Mn), and zinc (Zn), are essential micronutrients required for normal physiological processes. They function as structural components of enzymes and metalloproteins and play important roles in oxygen transport, redox reactions, and cellular metabolism (Gailer, 2007). However, elevated concentrations of these metals can become toxic and may impair growth, reproduction, and survival of aquatic organisms (Genç & Yilmaz, 2015). Cadmium (Cd), in contrast, has no known biological function and is highly toxic even at low concentrations. Because metals can bioaccumulate in organisms and biomagnify through food webs, chronic exposure may cause structural and functional damage at the cellular and molecular levels and may ultimately threaten ecosystem integrity and human health (Öğlü et al., 2015; Duodu et al., 2017).
River and estuarine sediments are widely recognized as effective indicators of metal pollution because they act both as sinks and as secondary sources of contaminants (Pejman et al., 2015). Metals generally occur at much higher concentrations in sediments than in overlying water because they are rapidly associated with fine particles and organic matter after entering aquatic systems (Liu et al., 2018). Sediment-associated metals are of particular concern because they can be remobilized and taken up by benthic organisms and bottom-feeding fish, thereby transferring contamination to higher trophic levels (Krasnici et al., 2013). For this reason, assessments based solely on water chemistry may underestimate the long-term ecological significance of metal pollution.
To evaluate the extent and consequences of sediment contamination, a number of widely used indices have been developed. The Contamination Factor (CF), Enrichment Factor (EF), and Geoaccumulation Index (Igeo) are commonly used to distinguish natural background contributions from anthropogenic inputs. The Potential Ecological Risk Index (ER and RI) provides an integrated measure of the ecological threat posed by metals, taking into account both contamination levels and metal-specific toxicities. In addition, human health risk assessment based on Average Daily Dose (ADD), Hazard Quotient (HQ), Hazard Index (HI), and Cancer Risk (CR) has become a standard approach for estimating potential non-carcinogenic and carcinogenic effects associated with exposure to contaminated sediments.
Gökova Bay is located on the southwestern coast of Türkiye, at the transition between the Aegean and Mediterranean Seas, and has been designated as a Special Environmental Protection Area because of its exceptional ecological value and high biodiversity (Akyol et al., 2007). The bay supports extensive seagrass meadows, wetlands, and nursery habitats for numerous marine species, while also sustaining tourism, fisheries, and agriculture. Several streams and drainage channels transport freshwater and terrestrial materials from the surrounding watershed into the bay. Among these, Azmak, Akçapınar, and Çetibeli creeks drain catchments characterized by intensive agricultural activities, including citrus and maize cultivation, as well as increasing urban and tourism-related pressures. As a result, these waterways may act as important pathways for the transfer of metals and other contaminants to the coastal ecosystem.
The present study was designed to address the following research questions: (i) what are the concentrations and spatial distributions of Fe, Cu, Mn, Zn, and Cd in the water and surface sediments of Azmak, Akçapınar, and Çetibeli creeks? (ii) to what extent do these metals indicate anthropogenic contamination according to CF, EF, and Igeo? (iii) what are the potential ecological risks associated with these metals based on ER and RI? and (iv) do the measured concentrations pose non-carcinogenic or carcinogenic risks to adults and children exposed to contaminated sediments?
2. MATERIALS AND METHODS
2.1. Study Area
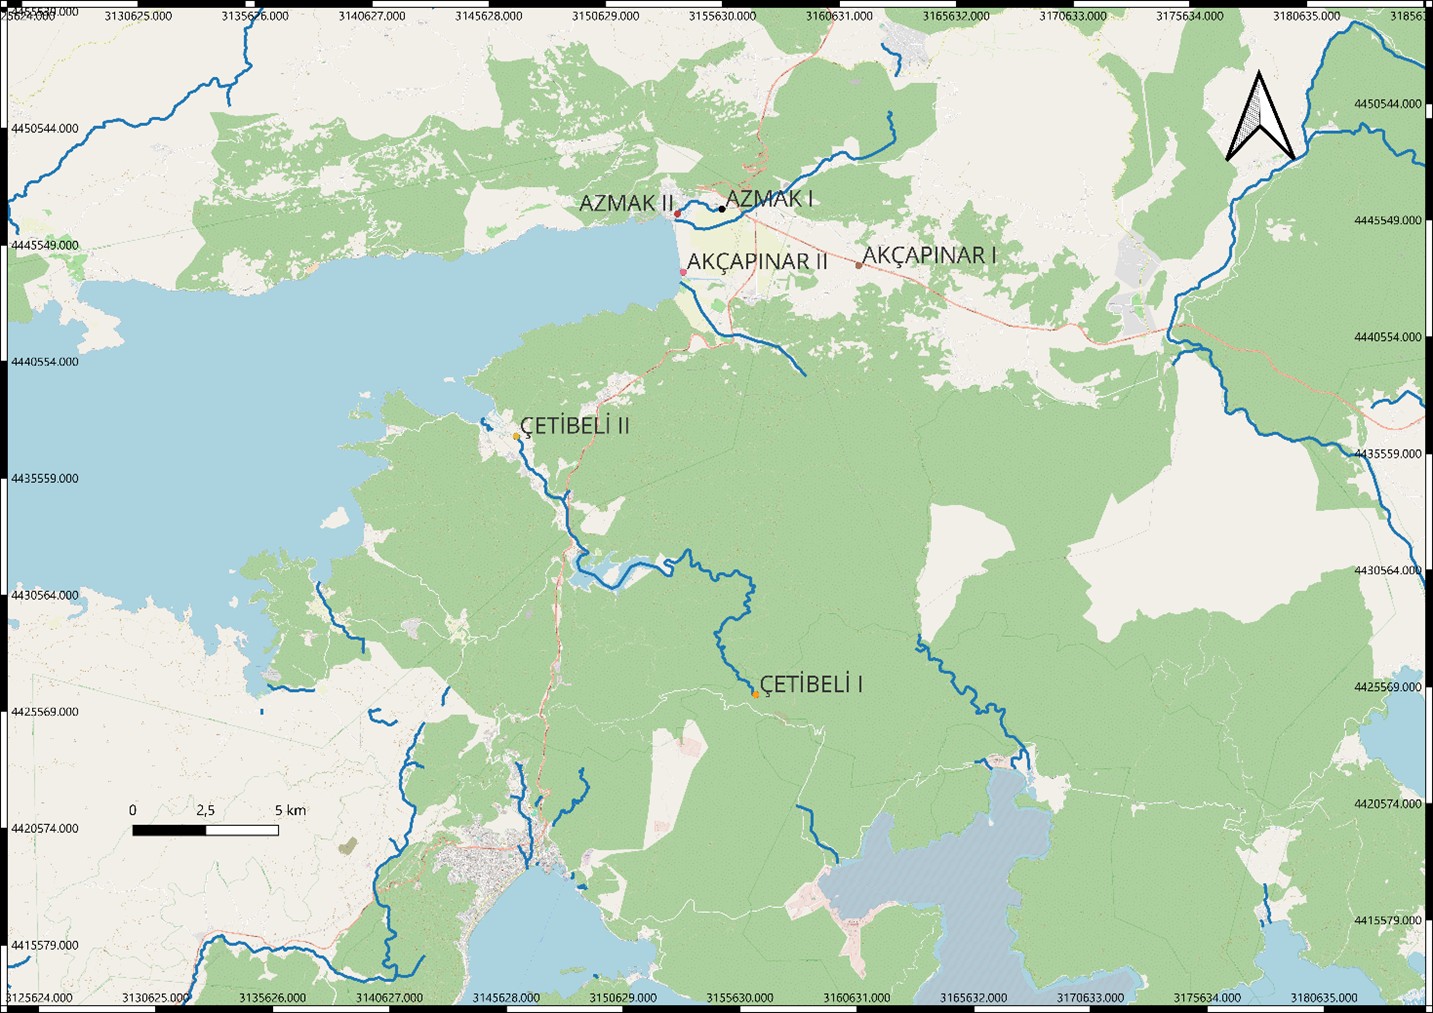
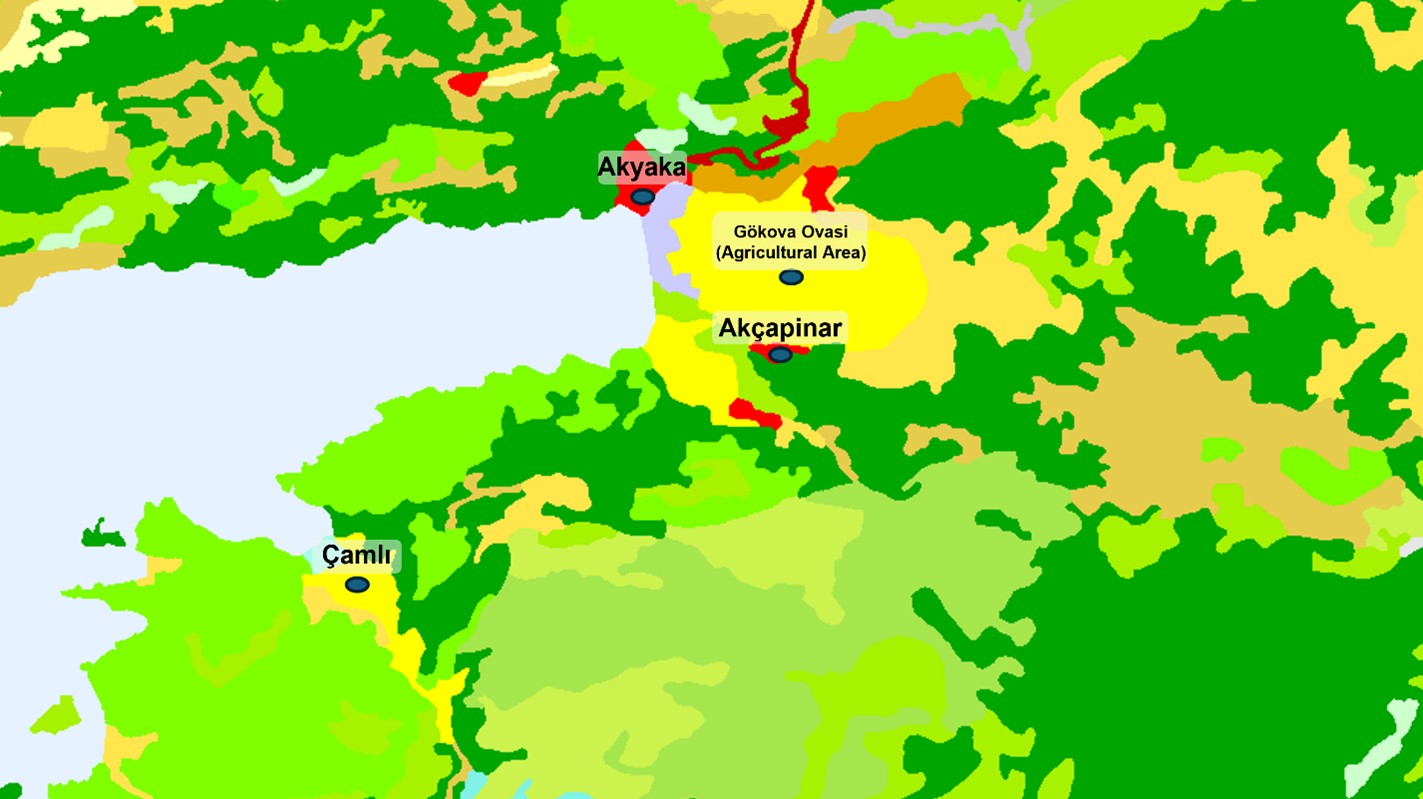
Gökova Bay, located in the region where the Aegean Sea meets the Mediterranean Sea, has been declared a Special Environmental Protection Area since 1989 as one of Turkey's eight marine protection zones with an area of 52 thousand hectares, of which 24500 hectares is land area (Akyol et al., 2007). Many large and small rivers flow into the Gulf. This study was carried out for two Creek and Stream (Azmak, Akçapınar and Çetibeli) flowing into the Gökova Gulf between 2023 April and 2024 March. Akçapınar Creek is situated in Ataköy, 2000 meters north-east of the road, after the Marmaris exit of the Muğla-Fethiye Highway. Akçapınar Creek section has a bottom width ranging between 7 - 20 m and a side height between 4 - 15 m. The Akçapınar Creek is lined with reeds and eucalyptus trees grow along its banks (Erdinç, 2010). Çetibeli Stream is located near the Marmaris–Muğla highway, about 8 km from the coast. The riverbed widens as it approaches the sea, which causes the flow rate to decrease even further during the year (Tuna & Çelik., 2009). The Azmak Creek springs from the point where the northern plain meets the Akyaka settlement area. It is observed that there is intense mossing in the Azmak Creek, which is 2 km long until the sea. It is also used for irrigation purposes in agriculture at the exit point of Azmak Creek. Creek is covered with reeds, and the stream bed is wide (Erdinç, 2010). As shown in Figure 1, samples were collected from sites marked as I, representing locations near the headwaters of the creeks, and from sites marked as II, corresponding to downstream locations close to where the creeks discharge into the marine environment. The study involved fieldwork at 3 main stations and 2 independent interruptions at each station; the location of these points is presented in Figure 1. Samples were collected regularly during the first week of each month throughout the year, and samples from each location were analyzed independently. Water samples were distributed into 40 mL polyethylene bottles, carefully washed with acid to avoid surface sediment, and manually stabilized with 0.5 % concentrated nitric acid (HNO3). Sediment samples were collected as physiological samples according to the US EPA (2001) standard protocol. Those brought to the laboratory were dried at 105 °C for 24 hours and then passed through a 60 mesh stainless steel sieve to ensure homogeneity. Ultrapure water (Direct-Q 8UV, Germany) was used for all analyses and solution preparation. The elements were analyzed using ICP/AES (Optima 2000-Perkin Elmer), which is a fast multielement technique with a dynamic linear range and moderate-low detection limits (Sturgeon, 2000). National Research Council Canada SPS-SW1 (for water) and WQB1 (for sediment)- National Water Research Institute were used to analyze the heavy metals. The analysis was performed using specific absorption wavelengths and detection limits for each element. The values were recorded as follows: Cd (228.804 nm; 0.001 μg g⁻¹), Cu (324.75 nm; 0.01 μg g⁻¹), Pb (220.35 nm; 0.0042 μg g⁻¹), Zn (206.20 nm; 0.0059 μg g⁻¹), Cr (276.716 nm; 0.0071 μg g⁻¹), Hg (253.652 nm; 0.0610 μg g⁻¹), and As (193.696 nm; 0.0530 μg g⁻¹). Examination of the Copernicus CORINE map (CLMS, 2018) (Figure 2) showing the land use structure of the region reveals that the majority of the basin consists of natural woodlands (green), but there are also settlements (red) as well as dense agricultural lands (yellow and orange), especially along the coastline and drainage channels. This data demonstrates the interaction of agricultural activities with the stations where the samples were collected.
2.2. Instrumentation
The Agilent Technologies 200 series atomic absorption spectroscopy (Agilent Technologies, 240FS AA) located in the Environmental Problems Research and Application Unit of the Muğla Sıtkı Koçman University Research Laboratories Application and Research Center was used in the studies. Argon (Ar) gas with 99.999% purity was used in experimental studies. Medical-grade compressed acetylene gas was used to produce an air-acetylene flame. The flame atomic absorption spectrometry (FAAS) method was used to determine the Fe concentration in water and sediment samples. A deuterium (D2) background correction system was used to eliminate background interference. An air/acetylene mixture was used as the flame source.
The air/acetylene ratio was13.5/2.1 (L /minute). A Fe hollow cathode lamp was used as the continuous light source. In the experimental studies, the wavelength, lamp current and slit width were 248.3 nm, 7.0 mA, and 0.2 nm, respectively. In the FAAS method, peak height was used as the basis for absorbance measurements of analyte signals. The Cu, Mn, Cd, and Zn concentrations in the samples studied were determined using the PSD120 automatic sampler with a graphite furnace atomic absorption spectrometer (GFAAS) method (Agilent Technologies GTA 120) equipped with a deuterium (D2) background correction system. A hollow cathode lamp specific to each element was used as the continuous light source. Ar gas was used as the carrier gas in the GFAAS method. The wavelength, lamp current, and bandwidth values used for the elements analyzed by the GFAAS method are given in Table 1.
|
Table 1. Other operating conditions for elements determined by the GFAAS method. |
||||
|
Parameter |
Cu |
Mn |
Zn |
Cd |
|
Wavelength (nm) |
324.7 |
279.5 |
213.9 |
228.8 |
|
Lamp current (mA) |
3.0 |
5.0 |
5.0 |
3.0 |
|
Slit width (nm) |
0.5 |
0.2 |
0.5 |
0.5 |
2.3. Accuracy Check
CRM023 (sandy loam 7) and NIST SRM 1643e (trace elements in water) certified reference materials (CRMs) were analyzed to test the accuracy of the method used to determine metal concentrations in water and sediment samples. The CRM023 certified reference material in solid form was subjected to a digestion process prior to analysis. 0.1 g of CRM023 was weighed and taken into a Teflon container. 6.0 mL of concentrated HCl, 2.0 mL of concentrated HNO3, and 2.0 mL of concentrated HF were added to this. The mixture was digested using a microwave digestion unit (CEM Mars 6). The final volume was diluted to 50.0 mL with ultrapure water. The heating program of the microwave oven was as follows: The heat was run up to 200 °C in 20 minutes and kept constant for 20 minutes at this temperature (Yildiz et al., 2024). In the analysis of CRMs, external calibration curves were constructed for each detected metal, and no standard addition procedure was required. Three subsequent readings were obtained for each metal, and the results were reported as average values. When the obtained results were compared with certified values, they showed good agreement at a 95 % confidence level. The recovery values of the analyzed metals were quite good, ranging from 98.9 % to 105.4 % for CRM023 and from 98.3 % to 101.7 % for NIST SRM 1643e. The results are presented in Table 2.
|
Table 2. Analysis results of the metals in the CRMs. |
||||||
|
|
CRM023 |
NIST SRM 1643e |
||||
|
Analyte |
Certified value (mg kg-1) |
Found value (mg kg-1) |
Recovery (%) |
Certified value (µg L-1) |
Found value (µg L-1) |
Recovery (%) |
|
Cu |
35.0 ± 2.4 |
36.9 ± 0.8 |
105.4 |
22.76 ± 0.31 |
22.89 ± 0.65 |
100.8 |
|
Fe |
1070 ± 80 |
1096 ± 43 |
102.4 |
98.1 ± 1.4 |
99.5 ± 0.9 |
101.4 |
|
Mn |
8.91 ± 0.70 |
9.05 ± 0.26 |
101.6 |
38.97 ± 0.45 |
38.31 ± 1.14 |
98.3 |
|
Cd |
14.5 ± 0.6 |
14.9 ± 0.57 |
102.8 |
6.568 ± 0.073 |
6.513 ± 0.095 |
99.2 |
|
Zn |
105.3 ± 5.4 |
104.1 ± 2.9 |
98.9 |
78.5 ± 2.2 |
79.8 ± 1.6 |
101.7 |
2.4. Contamination Factor (CF)
The contamination factor (CF) is a numerical metric used to quantify the extent of metal contamination resulting from anthropogenic (human) activities (Ahmed et al., 2016). It is calculated as the ratio of the metal concentration in the analyzed sediment to the concentration in the background environment, following the methodology outlined by Hakanson (1980). In this study, background concentration values (in mg/g) were adopted from Taylor & McLennan (1995) and are as follows: Fe (30890), Cu (25), Co (10), Mn (540), Cd (0.098), Zn (71), Ni (20), Pb (20), As (1.5), and Cr (35).

2.5. Enrichment Factor (EF)
The Enrichment Factor (EF) was used to determine the concentration of Ms in sediment (Li et al., 2014). The methodology followed was consistent with that described by Müller et al. (1979):

where, Mi and Mb denote the concentrations of metals in the sample and the background, respectively. The iron levels in both the background and the sample were determined by Taylor & McLennan (1995) and were represented by the subscripts Feb and Fei, respectively.
2.6. Ecological Risk Assessment (RI)
The potential ecological risk index (RI) is calculated using the following formula:

where, Tri represents the toxicological response factor of individual metals, with values as follows: Cu, Co, Ni, and Pb = 5; Mn and Zn = 1; As and Cr = 2; and Cd = 30 (Duodu et al., 2016). Similarly, CFi represents the contamination factor of individual metals. The modified potential ecological risk index (MRI) is calculated as follows. In this equation, EF represents the enrichment factor of each metal in the sediment.
2.7. Assessment of Human Health Risks
This study assesses the relationship between human health (HH) and the concentration of metals using the HH threat evaluation method, as outlined in the guidelines issued by the U.S. Environmental Protection Agency (US EPA, 2015). The health risk (HR) evaluation of sediment from Türkiye was conducted to estimate both carcinogenic and non-carcinogenic health risks to humans via two primary exposure pathways: ingestion and dermal contact. The HR levels vary across sites depending on the duration of exposure, metal tolerance level, lifestyle, body weight, and individual habits (Swarnalatha et al., 2015). The ingestion route is considered the primary exposure pathway, while dermal contact is also a significant exposure route for both children and adults (US EPA, 2015).
The HR levels were assessed by calculating the average daily dose (ADD). The ADD is defined as the estimated exposure intensity for a specific factor, indicating a low likelihood of adverse effects over a person’s lifetime (Swarnalatha et al., 2015).
The ADDi for ingestion and the ADDd for dermal pathways were determined as follows.
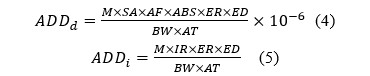
In this equation, ADDi (mg/kg/day) and ADDd (mg/kg/day) represent the average daily doses by ingestion and dermal absorption, respectively, for a specific heavy metal. M represents the mean concentration of Cd, Fe, Co, Mn, As, Pb, Cr, Cu, Zn, and Ni (Table 3). The Human Health Risk Assessment (HH) utilized defined physiological and exposure parameters for the target populations of adults and children (US EPA, 2011). For these calculations, the Ingestion Rate (IR) was adopted as 0.1 g/day for adults and 0.2 g/day for children. The Exposure Frequency (ER) has been set at 60 days per year. This figure was specifically chosen to reflect the active summer recreational season in the Gökova region and the periods during which tourists are present. This approach moves away from the overly conservative residential assumption (365 days/year) and aligns with guidelines regarding the recreational use of beaches, as well as with recent literature on sediment risk assessment (NHDES, 2019 ; Miletic et al., 2023), while the Exposure Duration (ED) was assumed to be 30 years for adults and 6 years for children (US EPA, 2011; Iqbal et al., 2013). The Skin Surface Area (SA) for existing exposure events was set at 4,350 cm2/event for adults and 1,600 cm2/event for children (US EPA, 2004). The Sediment to Skin Adherence Factor (AF) for the contaminant was used as 0.2 mg/cm2 for children and 0.7 mg/cm2 for adults. The Absorption Factor (ABS) was adjusted to 0.001 for children and 0.01 for adults, and the Conversion Factor (CR) was kept constant at 10-6 kg/mg (US EPA, 2004). The Body Weight (BW) standard values are 70 kg for adults and 15 kg for children, and the Average Time (AT) values used in the calculations were determined as 10,950 days (30 years) for adults and 2,190 days (6 years) for children (US EPA, 2011). Furthermore, the specific Reference Dose (RfD) values for the evaluated metals were retrieved from the most updated USEPA Regional Screening Levels summary tables (US EPA, 2023). Based on these guidelines, the RfD values for the ingestion pathway (RfDi) are specified as follows: Fe (0.3), Cu (0.04), Mn (0.014), Cd (0.0005), and Zn (0.3) mg/kg/day. Similarly, the RfD values for the dermal exposure pathway (RfDd) are specified as: Fe (4.50E-02), Cu (0.012), Mn (1.84E-03), Cd (1.00E-05), and Zn (0.06) mg/kg/day.
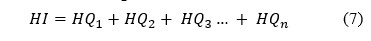
Hazard quotients (HQ) were calculated based on ADDi and ADDd values. The hazard quotient (HQ) is defined as the ratio of the average daily dose (ADD) from ingestion and dermal exposure to their respective reference doses (RfDi and RfDd) (Genthe et al., 2013; US EPA, 2015). The HQ was calculated using the following formula:

The HQ values greater than one represent the potential of the HM to harmfully affect the health of humans by non-carcinogenic threats. To determine the total potential of non-carcinogenic threat originated by more than one route, the hazard index (HI) is established, which is the addition of the HQ values. The HI values for ingestion and dermal pathways were determined. The variable indicates the finite number of HQ used for determination of HI. It is calculated using the formula (Xiao et al., 2015):
2.8. Carcinogenic Risk Assessment
The potential carcinogenic effects of heavy metals in sediments on human health were calculated according to deterministic risk assessment protocols developed by the US EPA. Carcinogenic risk (CR) represents the probability of an individual developing cancer over a lifetime and is obtained by multiplying the Lifetime Average Daily Dose (LADD) by the Cancer Slope Factor (SF). (US EPA, 1989; 2011). LADD values for ingestion and dermal contact routes were calculated using the following formulas specified in the US EPA Exposure Factors Guide (US EPA, 2011):
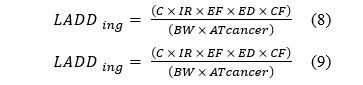
In these formulas, the lifetime cumulative effect of exposure is considered in carcinogenic risk assessment, and the average time (ATcancer) has been fixed at 70 years (25,550 days) for both adults and children in accordance with US EPA standards (US EPA, 2011).
Cancer Slope Factors (SF) have been included primarily based on the US EPA IRIS (2024) database. Although there is no officially established oral SF value for cadmium (Cd) by the US EPA, a proxy value was selected from the literature due to the sensitive ecological condition of the study area and in accordance with the “Precautionary Principle.” In this context, the widely accepted value of 0.38 (mg/kg-day)⁻¹ from the literature was used to assess the risk of oral exposure to Cd (Wu et al., 2015; Okoro et al., 2024). The coefficients required for dermal exposure were derived by dividing the oral SF values by the gastrointestinal absorption factors (ABSgi), as specified in the US EPA guidance.
The total cancer risk (CRtotal) was calculated as the sum of individual exposure pathways:

The results were interpreted according to the following threshold values established by the US EPA: CR < 10-6 negligible risk; 10-6 < CR <10-4: acceptable or tolerable risk range; CR > 10-4: indicates that the potential carcinogenic risk is significant and requires regulatory action.
Statistical analyses and group comparisons were performed using the open-source software jamovi (Version 2.6.44). The resulting data and subsequent inferences are detailed in Section 3.
3. RESULTS AND DISCUSSION
3.1. Metals Present in Sediments from Gökova
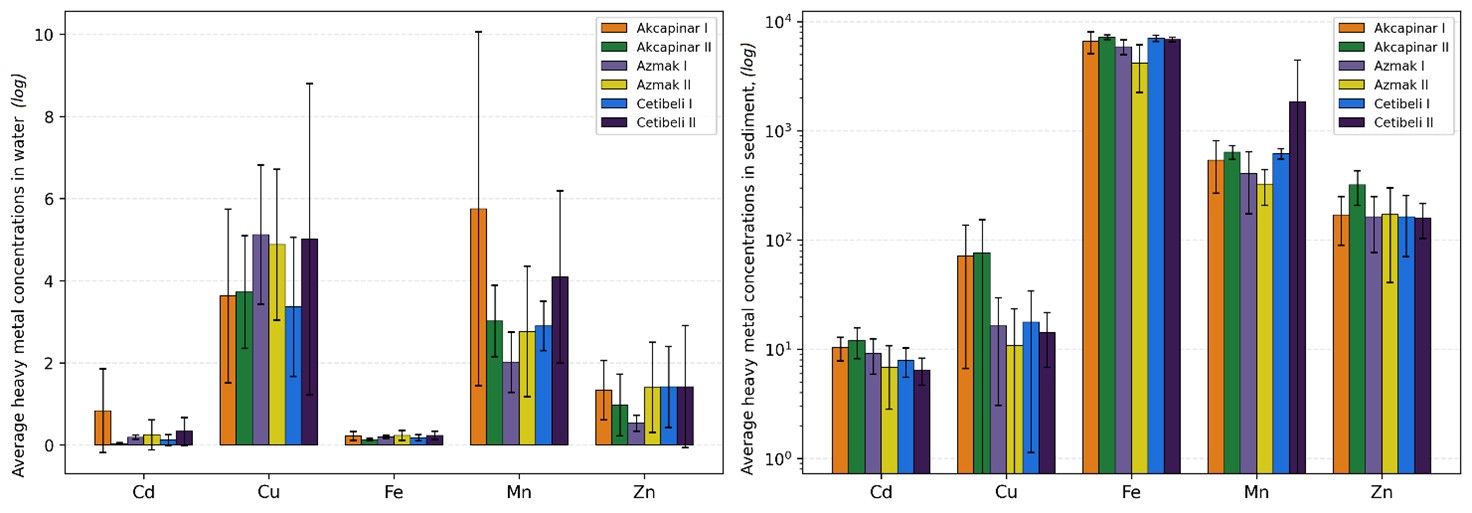
Metal concentrations in sediment samples collected from three different Creeks in Gökova region were determined (Figure 2). The highest metal concentrations of Fe (7812.06 mg/kg), Zn (430.06 mg/kg) and Cd (18.84 mg/kg) were analyzed in the samples taken from Akçapınar II region. The highest concentrations of Cu (218.34 mg/kg) and Mn (1637.20 mg/kg) were found in the samples taken from Azmak II and Çetibeli II regions, respectively. The average metal concentrations in water samples collected from Creek are presented in Figure 3 The highest Cu concentration (12.15 mg/kg) in summer and Zn concentration (4.986 mg/kg) in autumn were analyzed in Çetibeli II region. The highest Fe concentration (0.456 mg/kg) in the samples obtained in Azmak II region was analyzed in summer, while the highest concentrations of Mn (12.71 mg/kg) and Cd (2.78 mg/kg) in Azmak I region were observed in autumn. The average metal concentrations in water samples collected from Creek are presented in Figure 3. The highest Cu concentration (12.15 mg/kg) in summer and Zn concentration (4.986 mg/kg) in autumn were analyzed in Çetibeli II region. The highest Fe concentration (0.456 mg/kg) in the samples obtained in Azmak II region was analyzed in summer, while the highest concentrations of Mn (12.71 mg/kg) and Cd (2.78 mg/kg) in Azmak I region were observed in autumn. Sediment samples collected from three different sites in the Gökova Region. Based on the sediment data from the Gökova Region, the average concentrations of metals are as follows: Fe 6272.30 mg/kg), Cu (20.17 mg/kg), Mn (604.48 mg/kg), Zn (190.579 mg/kg), and Cd (8.759 mg/kg) (Table 3).
|
Table 3. Comparison of metal concentrations in sediment samples collected from the creek according to different guidelines (mg/kg). |
||||||||||
|
|
Fe (n = 72) |
Cu (n = 72) |
Mn (n = 72) |
Zn (n = 72) |
Cd (n = 72) |
Reference |
||||
|
Minimum |
1475.64 |
0.76 |
163.62 |
57.11 |
2.36 |
This Study |
||||
|
Maximum |
7812.06 |
53.1 |
1637.2 |
452.1 |
18.84 |
|||||
|
Mean |
6272.3 |
20.17 |
604.48 |
190.57 |
8.75 |
|||||
|
Standart Error |
174.018 |
1.62 |
36.74 |
12.8 |
0.415 |
|||||
|
Skewness |
-1.495 |
0.356 |
0.884 |
0.887 |
0.461 |
|||||
|
Kurtosis |
1.485 |
-1.154 |
1.088 |
-0.453 |
-0.047 |
|||||
|
Normality test (p-value) |
p<0.001 |
0.013 |
p<0.001 |
0.006 |
0.125 |
|||||
|
Munzur River, Türkiye |
22973-179471 |
4.5-33.25 |
133-982.5 |
17.5-77.5 |
0.92-3.09 |
Kutlu (2023) |
||||
|
Pülümür River Türkiye |
22100-39100 |
18.8-35.6 |
340-711 |
37-79 |
0.1-0.4 |
Kutlu et al. (2025) |
||||
|
Gökova Bay, Türkiye |
64.872 |
6.04 |
466.2 |
55.15 |
<0.01 |
Balkıs et al. (2010) |
||||
|
Köyceğiz Lagoon,Türkiye |
- |
0.25-0.51 |
- |
- |
<0.01 |
Yabanlı et al. (2021) |
||||
|
Seyhan River, Türkiye |
- |
6.12-57.22 |
143.92-638.32 |
34.21-146.04 |
- |
Davutluoglu et al. (2011) |
||||
|
NE Mediterranean,Türkiye |
- |
- |
- |
- |
0.35 |
Çiftçi et al. (2020) |
||||
|
Eastern Mediterranean, Türkiye |
28262 |
14.8 |
- |
62.6 |
0.2 |
Kurnaz et al. (2022) |
||||
|
Kizkalesi Coast, Türkiye |
11500 |
8.3 |
- |
22.1 |
0.08 |
Yalçın & İlhan (2008) |
||||
|
Çömlekçi Stream, Türkiye |
8597 |
35.26 |
297.7 |
60.09 |
0.11 |
Ustaoğlu (2020) |
||||
|
Eastern St. Martin’s Island, Bangladesh |
143.8 |
3.76 |
269.5 |
27.17 |
- |
Bhuyan et al. (2023) |
||||
|
Hindon River, India |
- |
35.6-194.7 |
61.3-201 |
- |
1.3–3.28 |
Suthar et al. (2009) |
||||
|
Mediterranean Database |
- |
18.2 |
420 |
62.4 |
0.15 |
Richir & Gobert (2016) |
||||
|
Louro River, Spain |
- |
30.5-55.9 |
|
- |
0.371-1.4 |
Filgueiras et al. (2004) |
||||
|
Australian Interim |
11.5-62.8 |
6.3-55.6 |
232-3.26 |
26.4-100 |
0.02-0.16 |
De Caritat et al. (2011) |
||||
|
Sediment Quality Guidelines |
||||||||||
|
ERL |
- |
70 |
- |
120 |
5 |
Bai et al. (2011) |
||||
|
ERM |
- |
390 |
- |
270 |
9 |
Bai et al. (2011) |
||||
|
TRV |
- |
16 |
- |
110 |
0.60 |
Mohiuddin et al. (2011) |
||||
|
WSA |
- |
32 |
- |
129 |
0.30 |
Martin & Meybeck (1979) |
||||
|
WCTMRL |
- |
20-90 |
- |
50-250 |
0.1-1.5 |
Forstner & Wittmann (1981) |
||||
|
TEL |
- |
35.7 |
- |
123 |
0.59 |
MacDonald et al. (2000) |
||||
|
PEL |
- |
197 |
- |
315 |
3.53 |
MacDonald et al. (2000) |
||||
Additionally, normality tests are carried out and p-values from Shapiro-Wilk test are provided in Table 3. Except for Cd, other metal concentrations do not have normal distributions. Therefore, nonparametric statistical tests such as Mann-Whitney-U and Kruskal-Wallis test are applied for the comparisons.
The distribution of the analyzed metal values shows a right-skewed pattern (with extreme values on the right), as the skewness values for all metals, except for Fe, are greater than 0. Conversely, Fe shows a left-skewed distribution (with extreme values on the left) due to its skewness value being less than 0. Kurtosis values indicate a negative trend for Cu, Zn, and Cd, suggesting a more pointed distribution with more extreme values. In contrast, Fe and Mn exhibit positive kurtosis, indicating a flatter and wider distribution with fewer extreme values (Beaver et al., 2012).
The concentrations of Zn and Cd in sediment samples from the Gökova Region exceed the Australian Interim Sediment Quality Guidelines and the Effect Range Low (ERL) standards. However, according to the Effect Range Medium (ERM) standards, none of the metals in the samples exceed the limits. The results also show that Cu, Zn, and Cd exceed the toxicity reference values (TRV) indicated in Table 3. According to the World Surface Rock Average (WSA) values, the concentrations of Zn and Cd in the Gökova region are considered high. When compared to the Worldwide Commonly Found Trace Metal Range in Lakes (WCTMRL), Cu and Zn are found to be at average levels, while Cd exceeds normal concentrations. In terms of Threshold Effect Level (TEL) or Potential Effect Level (PEL) values for freshwater ecosystems, Zn accumulation in the Gökova region only exceeded the TEL value, while Cd concentration showed accumulation levels higher than both the TEL and PEL standards. Drainage channels such as Akçapınar and Azmak within the boundaries of the Gökova Special Environmental Protection Area (SEPA) carry runoff water from nearby corn and citrus orchards directly into the sedimentary environment. Considering that phosphate fertilizers increase the mobility of cadmium (Cd) in the soil, the high contamination levels of 8.75 mg/kg detected at the outlets of these channels clearly document the extent of agricultural contamination. Drainage channels such as Akçapınar and Azmak within the boundaries of the Gökova Special Environmental Protection Area (SEPA) carry runoff water from nearby corn and citrus orchards directly into the sedimentary environment. Considering that phosphate fertilizers increase the mobility of cadmium (Cd) in the soil, the high contamination levels of 8.75 mg/kg detected at the channels clearly document the extent of agricultural contamination. When we compare our findings with those from other basins in Türkiye, the extent of the risk becomes clearer. For example, in a study conducted on the Çömlekçi Creek in the Eastern Black Sea region (Ustaoğlu, 2020), Cd concentrations were found to be at a very low level of 0.11 mg/kg, and it was reported that this did not pose a risk to human health. The value of 8.75 mg/kg that we detected is approximately 80 times higher than this reference. Cd values (< 0.01 mg/kg) detected in the Köyceğiz Lagoon System (KLES), the geographically closest neighboring basin (Yabanlı et al., 2021), are also far below our findings. This situation demonstrates that the pollution in Gökova constitutes a local “hotspot.” Compared to studies in other regions, Munzur River sediments contain Fe (22,973 - 179,471 mg/kg), Cu (4.50 - 33.25 mg/kg), Mn (133 - 982.5 mg/kg), Zn (17.50 - 77.50 mg/kg), and Cd (0.92 - 3.09 mg/kg) (Kutlu, 2023), while Pülümür River sediments contain Fe (22,100 - 39, 100 mg/kg), Cu (18.80 - 35.60 mg/kg), Mn (340 - 711 mg/kg), Zn (37.00 - 79.00 mg/kg), and Cd (0.10 - 0.40 mg/kg) concentrations. A previous study in the Gökova region reported values of Fe (64,872 mg/kg), Cu (6.04 mg/kg), Mn (466.2 mg/kg), Zn (55.15 mg/kg), and Cd (< 0.01 mg/kg) (Balkıs et al., 2010). In the Bangladesh reported lower concentrations of Mn (269.5 ± 33.0 mg/kg), Fe (143.8 ± 21.7 mg/kg), Zn (27.2 ± 4.34 mg/kg), and Cu (3.76 ± 0.60 mg/kg) (Bhuyan et al., 2023). On an international scale, when compared to a study (Richir & Gobert, 2016) comprising 1,210 stations in the Mediterranean basin, the Cd levels in our study fall within the top 2.7 % of the most polluted stations along the entire Mediterranean coast. Even along the eastern Mediterranean coast (Mersin/Iskenderun), where industrial activity is intense, Cd values have been reported in the range of 0.10 - 0.26 mg/kg (Kurnaz et al., 2022); the value of 8.75 mg/kg in Gökova demonstrates the extent of agricultural pollution. Furthermore, comparisons with studies by Çiftçi et al. (2020) and Yalçın & İlhan (2008) confirm that pollution in Gökova involves significantly higher Cd accumulation than in regions focused on tourism or industry.
When comparing our data with other studies in the literature, it is evident that Cd, Zn, and Mn levels are significantly higher than in regions such as Gökova Bay, East St. Martin's (Bangladesh), and the Hindon River (India). This difference indicates a more intense accumulation of these metals in the study area relative to the other regions. In contrast, Fe and Cu concentrations remained below or at similar levels to the values observed in the Munzur, Pülümür, and Louro (Spain) rivers. Therefore, it can be said that the pollution pressure in the region regarding Fe and Cu is lower compared to the other comparison areas.
A detailed comparison of our findings with the literature reveals that the sediments in the region are subject to significant accumulation, particularly regarding Cd and Zn. For instance, while Cd levels were reported at a maximum of 0.40 mg/kg in the Pülümür River and remained below detection limits (< 0.01 mg/kg) in Gökova Bay, they reached a remarkably high average of 8.75 mg/kg in our study, standing in sharp contrast to these other basins. Similarly, the maximum Mn accumulation, which was recorded at 201 mg/kg in the sediments of the Hindon River in India, was measured at an average of 604 mg/kg in our field, indicating a density approximately three times higher than this reference region.
In contrast, a completely different picture emerges when examining Fe and Cu concentrations. Compared to the Fe load, which reaches up to 179,471 mg/kg in the Munzur River and 39,100 mg/kg in the Pülümür River, the average value of 6,272 mg/kg in our study area remains quite low. Additionally, Cu levels reported in studies of the Louro River in Spain (30.5 - 55.9 mg/kg) and the Hindon River (35.6 - 194.7 mg/kg) are also above our measured average of 20.17 mg/kg. This situation demonstrates that the pollution pressure in the study area is not distributed evenly across all metals, but rather points to a contamination pattern specifically driven by Cd and Zn.
We used the non-parametric Kruskal–Wallis H test to evaluate (i) spatial differences among the six sampling stations and (ii) temporal differences among the four seasons (Winter, Spring, Summer, Autumn), treating each metal independently. When the overall test was significant (p < 0.05), pairwise contrasts were obtained with Dunn's post-hoc test and p-values were adjusted for multiple comparisons using the Bonferroni correction. This two-step procedure identifies which specific stations or seasons cause the overall difference while controlling the error rate. The results are provided in following Table 4 and Table 5 below.
|
Table 4. Kruskal–Wallis test for spatial differences in heavy metal concentrations in sediments among the six sampling stations. Significant pairwise differences from Dunn’s post-hoc test with Bonferroni correction are listed in the last column. |
|||
|
Metal |
H statistic |
p-value |
Significant pairs (Dunn, Bonferroni p < 0.05) |
|
Fe |
26.29 |
< 0.001 |
Akç-1 ≠ Azm-2; Akç-2 ≠ Azm-2; Azm-2 ≠ Çet-1 |
|
Cu |
37.31 |
< 0.001 |
Akç-1 ≠ Azm-1; Akç-1 ≠ Azm-2; Akç-1 ≠ Çet-1; Akç-1 ≠ Çet-2; Akç-2 ≠ Azm-1; Akç-2 ≠ Azm-2; Akç-2 ≠ Çet-2 |
|
Mn |
40.92 |
< 0.001 |
Akç-1 ≠ Çet-2; Akç-2 ≠ Azm-2; Akç-2 ≠ Çet-2; Azm-1 ≠ Çet-2; Azm-2 ≠ Çet-2; Çet-1 ≠ Çet-2 |
|
Zn |
15.66 |
0.008 |
Akç-2 ≠ Azm-1; Akç-2 ≠ Azm-2; Akç-2 ≠ Çet-1 |
|
Cd |
21.11 |
< 0.001 |
Akç-1 ≠ Çet-2; Akç-2 ≠ Azm-2; Akç-2 ≠ Çet-2 |
|
Table 5. Kruskal–Wallis test for seasonal differences in heavy metal concentrations in sediments. Months were grouped into Winter, Spring, Summer and Autumn. |
|||
|
Metal |
H statistic |
p-value |
Significant seasonal pairs (Dunn, Bonferroni p < 0.05) |
|
Fe |
0.23 |
0.972 |
none |
|
Cu |
2.79 |
0.425 |
none |
|
Mn |
2.24 |
0.524 |
none |
|
Zn |
3.09 |
0.377 |
none |
|
Cd |
13.59 |
0.004 |
Spring ≠ Summer; Spring ≠ Autumn |
Regarding the Table 4, the Kruskal–Wallis test detected highly significant differences among stations for all five metals (Fe: H = 26.29, p < 0.001; Cu: H = 37.31, p < 0.001; Mn: H = 40.92, p < 0.001; Zn: H = 15.66, p = 0.008; Cd: H = 21.11, p < 0.001). Dunn’s post-hoc test indicated that station Akç-2 was the most distinct, differing significantly from the Azmak and Çetibeli stations for Cu, Zn and Cd, and emerging as the principal contamination hotspot. Cu showed the largest number of significant pairwise contrasts (7), reflecting a strong between-station gradient at Akçapınar.
In contrast to the marked spatial variability, no seasonal effect was detected for Fe, Cu, Mn or Zn (all p > 0.37), indicating that the sediment metal load is governed by station-specific sources rather than by hydrological seasonality. Cd was the only exception (H = 13.59, p = 0.004), with spring concentrations significantly higher than those in summer (p_bonf = 0.042) and autumn (p_bonf = 0.004), a pattern consistent with leaching of agricultural inputs during the wet season.
3.2. Water Parameters
Water quality measurements collected from six sampling stations are presented in Table 6. Water temperature ranged from 18.51 °C to 23.43 °C, with the lowest value recorded at the Azmak I station and the highest at Çetibeli II. pH values ranged between 8.65 and 9.13, indicating that the water at all stations was slightly alkaline in character. Significant variation was observed among stations in electrical conductivity (EC). The lowest EC value was measured at Çetibeli I (3.98 mS cm-1), while the highest was recorded at Çetibeli II (150.42 mS cm-1), suggesting differences in the concentration of dissolved ions across the sampling locations. Dissolved oxygen (DO) concentrations varied between 6.47 and 8.22 mg L-1. The oxygen levels at all stations were within ranges that can support aquatic organisms, with the Azmak stations generally showing higher values (EPA, 2021). Concentrations of nitrite (NO₂⁻) and nitrate (NO₃⁻) were relatively low, ranging from 0.03–0.07 mg L⁻¹ and 0.14 - 0.41 mg L-1, respectively. Ortho-phosphate (PO₄³⁻) concentrations were also low at all stations, varying between 0.06 and 0.08 mg L-1. Total hardness showed marked differences among the sampling sites. The lowest value was measured at Çetibeli I (23.80°dH), while the highest was found at Çetibeli II (43.70°dH). Calcium (Ca²⁺) concentrations ranged from 17.60 to 89.33 mg L⁻¹, with the maximum value recorded at Akçapınar I and the minimum at Çetibeli II. In contrast, magnesium (Mg²⁺) concentrations ranged between 46.93 and 137.71 mg L-1, reaching their highest level at Azmak II.
|
Table 6. Presents the average values of the water parameters. |
||||||||||
|
Station |
Water Tempe-rature |
pH |
Conductivity (µS cm-1) |
Dissolved Oxygen mg L-1 |
Nitrate (NO2) mg L-1 |
Nitrate (NO3) mg L-1 |
Ortho-Phosphate () mg L-1 |
Total hardness (0 dH) |
Calcium (Ca2+) mg L-1 |
Magnesium (Mg2+) mg L-1 |
|
Akçapınar I |
19,44 |
9,12 |
4,40 |
6,47 |
0,06 |
0,36 |
0,0800 |
25,23 |
89,32 |
46,92 |
|
Akçapınar II |
20,01 |
8,65 |
14,80 |
6,93 |
0,07 |
0,23 |
0,08 |
30,54 |
107,29 |
59,41 |
|
Azmak I |
18,51 |
8,52 |
20,01 |
7,34 |
0,04 |
0,06 |
0,08 |
38,67 |
59,74 |
122,31 |
|
Azmak II |
18,72 |
8,74 |
23,06 |
7,70 |
0,04 |
0,14 |
0,09 |
41,13 |
73,66 |
137,71 |
|
Çetibeli I |
22,56 |
8,83 |
3,98 |
7,80 |
0,04 |
0,08 |
0,09 |
23,80 |
52,26 |
71,78 |
|
Çetibeli II |
23,43 |
8,54 |
150,42 |
8,22 |
0,03 |
0,41 |
0,09 |
43,70 |
17,60 |
115,58 |
3.3. Contamination, Enrichment and Igeo Factors of metals
Metal concentrations in the sediment samples were evaluated using critical indicators such as the Contamination Factor (CF), the Enrichment Factor (EF), and the Geoaccumulation Index (Igeo) (Table 7). These factors are fundamental metrics for identifying anthropogenic metal inputs and quantifying the extent of metal biogeochemical accumulation in sediments relative to natural background levels (Khorshid & Thiele-Bruhn, 2016). The Contamination Factor (CF) results were used to assess the level of metal pollution in the sediment according to the Hakanson (1980) classification: CF < 1 (low contamination), 1 ≤ CF < 3 (moderate contamination), 3 ≤ CF < 6 (high contamination), and CF ≥ 6 (very high contamination). The analysis indicated that Cd (89.3528) signaled a very high contamination level (CF ≥ 6), while Mn (1.1194) and Zn (2.6841) were classified as exhibiting moderate contamination (1≤ CF <3). In contrast, Fe (0.2030) and Cu (0.8068) exhibited low contamination levels (CF < 1). The Enrichment Factor (EF) quantitatively expresses the accumulation of metals within the sediment matrix relative to their base concentrations, divided into five categories as defined by Sutherland (2000): EF < 2 (minimal enrichment), 2 ≤ EF < 5 (moderate enrichment), 5 ≤ EF < 20 (significant enrichment), 20 ≤ EF < 40 (high enrichment), and EF ≥ 40 (extreme enrichment). The EF values for the various metals are presented in Table 6. Findings revealed that Cd (455.045) showed extreme enrichment (EF ≤ 40), while Zn (13.3025) and Mn (5.4364) were classified under significant enrichment (5 ≤ EF < 20). Conversely, Cu (3.7333) remained within the moderate enrichment range (2 ≤ EF < 5). Our findings have been compared with those of previous studies. In another study conducted in the same region, low contamination and enrichment were reported for Fe (CF = 1.38; EF = 3.87), Cu (CF = 0.12; EF = 0.34), Mn (CF = 0.36; EF = 1.54), Zn (CF = 0.61; EF = 1.71), and Cd (CF = 0.03; EF = 0.09) (Balkıs et al., 2010). Similarly, a sediment study conducted on the Munzur River reported metal values of Fe (CF = 2.22; EF = 1.00), Cu (CF = 0.51; EF = 1.34), Mn (CF = 0.69; EF = 6.09), Zn (CF = 0.45; EF = 0.43), and Cd (CF = 1.58; EF = 0.03) metal values were reported (Kutlu, 2023). Sediment samples collected from Ras Abu Ali Island showed low contamination for Fe (0.10), Cu (0.09), Zn (0.07) and Ni (0.19), while EF values indicated minimum-to-medium enrichment for Cu (2.22), Ni (1.87) and Fe (0.97). Overall, these comparisons reveal that Zn and Cd metals in Gökova region sediments show relatively higher contamination compared to both Turkish river systems and foreign coastal sediments, indicating a potentially high ecological risk. The Geoaccumulation Index (Igeo) was calculated to sedimentological assess the contamination levels of the metals. According to the analysis, the Igeo values indicate that only Cd (5.7691) among the five analyzed metals is classified as highly contaminated (Igeo ≥ 5). In contrast, Zn (0.6208) is classified as uncontaminated to moderately contaminated (Igeo > 0 - 1), with no contamination detected in the remaining metals. Based on the Igeo analysis, only the metals Cd and Zn exceeded the Igeo standards. The average Igeo values of the metals in our study were compared with the findings reported in previous studies. Igeo contamination in the Çanakkale region has generally been reported as uncontaminated or slightly contaminated for Cu (0.51), Zn (0.45), Mn (-2.66), Fe (-1.17) and Cd (-0.04) (Oran & Erginal, 2023). The average Igeo values of sediment samples collected from the Iskenderun region were calculated as Cu (2.78), Zn (3.90), Mn (8.06), Fe (11.99) and Cd (-3.76), and high geoaccumulation was reported, particularly for Fe, Mn and Zn (Kutlu et al., 2021). Overall, these comparisons indicate that the sediments analyzed in our current study show high levels of contamination with Cd, while higher levels of geoaccumulation were reported for Fe, Mn, and Zn in other regions.
|
Table 7. Table showing the average CF, EF, Lgeo, ER and RI values of metals. |
||||
|
Average |
Contamination Factor (CF) |
Enrichment Factor (EF) |
Geoaccumulation index (Lgeo) |
Ecological Risk (ER) |
|
Fe |
0,2030 |
- |
-2,9437 |
- |
|
Cu |
0,8068 |
3,7333 |
-1,356 |
4,0340 |
|
Mn |
1,1194 |
5,4364 |
-0,6245 |
1,1194 |
|
Zn |
2,6841 |
13,3025 |
0,6208 |
2,6841 |
|
Cd |
89,3528 |
455,045 |
5,7691 |
2680,58 |
|
Risk Index (RI) |
- |
- |
- |
2688,42 |
An analysis of the source of the high Cd concentrations detected in the study area reveals that this contamination stems from anthropogenic factors rather than natural lithological processes. The fundamental geological structure of the Muğla and Gökova basins consists largely of ultramafic ophiolitic sequences and carbonate (karstic) formations. Although such ultramafic rock units inherently possess a high geochemical potential for elements such as Chromium (Cr) and Nickel (Ni) (Engin et al., 1987), they are quite poor in Cadmium (Cd) content. It is expected that natural background values in the region would be around 0.1 mg/kg, which is the continental crust average (Taylor & McLennan, 1995). Based on this information, the Cd enrichment detected in the sediments which reaches extreme levels in some areas indicates an anthropogenic (human-induced) input from outside the basin rather than natural weathering of the regional lithology. The high Cd levels in the study area are a characteristic result of the chemical fertilizers (particularly Triple Super Phosphate—TSP and Diammonium Phosphate—DAP) used in the intensive agricultural activities carried out in the Gökova Basin. These fertilizers, produced from phosphate rocks, contain high levels of Cd impurities derived from the raw material during the production process. Studies conducted in Türkiye confirm that phosphate fertilizers applied to agricultural lands may be a primary anthropogenic source of sediment contamination (Savcı, 2012). When combined with the geological reality of the region, these data support the hypothesis that the primary source of contamination is phosphate fertilizer residues discharged from neighboring agricultural lands in the region, which are known to contain high levels of Cd impurities. Therefore, it is geochemically impossible to explain the high Cd levels detected in our study by the weathering of the parent rock. Previous studies on Gökova Bay sediments (Balkis et al., 2010) also confirm that, unlike Cr and Ni, Cd enrichment is attributed to terrestrial runoff. Drainage channels such as Akçapınar and Azmak within the boundaries of the Gökova Special Environmental Protection Area (SEPA) carry runoff water from nearby corn and citrus orchards directly into the sedimentary environment. Considering that phosphate fertilizers increase the mobility of cadmium (Cd) in the soil, the high contamination levels of 8.75 mg/kg detected at the outlets of these channels clearly document the extent of agricultural contamination.
Apart from a natural geological source, intensive agricultural activities in the farmlands directly adjacent to the marine environment where samples were collected and extending over vast areas in the Gökova Basin (Figure 2.) emerge as the primary cause of Cd contamination. Phosphate fertilizers, widely used in these agricultural plains as clearly shown in the land-use map (Figure 2.), are the primary documented anthropogenic source of Cd worldwide (Nziguheba & Smolders, 2008). National studies analyzing the composition of commercial phosphate fertilizers and phosphate rocks used in Türkiye confirm quite high Cd impurities reaching up to 75 mg/kg (Köleli & Kantar, 2006). Furthermore, it has been statistically proven that the long-term and intensive use of these fertilizers is the primary cause of Cd accumulation in agricultural soils, particularly in regions without heavy industrial activity (Saltali et al., 2004). Consequently, when the region’s geochemical reality, literature data, and the basin’s agricultural structure are evaluated together, it has been concluded that phosphate fertilizer residues transported via surface runoff from agricultural plains are the primary source of the very high CF, extreme EF, and high Igeo values observed in Gökova sediments.
3.4. Ecological Risk Assessment of metals
The RI, derived from CF, was established by Hakanson (1980). It provides valuable information on contamination levels and the ecological risks associated with metals in sediments (Duodu et al., 2016). The classification of RI is as follows: RI < 150 indicates a low ecological risk, 150 ≤ RI < 300 represents a moderate risk, 300 ≤ RI < 600 signifies a considerable risk, and RI > 600 denotes a high ecological risk. The classification of potential ecological risk factors is as follows: ER < 40 indicates a low risk, 40 ≤ ER < 80 represents a moderate risk, 80 ≤ ER < 160 is considered considerable, 160 ≤ ER < 320 signifies a high risk, and ER > 320 denotes a very high ecological risk. Table 7 presents the ecological and modified ecological risk assessments for different metals. The RI values indicate a very high ecological risk in the sediments of Gökova. The ER values of Cd suggest that it may pose a higher ecological risk compared to other metals. The toxic response factor of Cd is higher than metals such as Cu, Mn, and Zn, which can be associated with its elevated ER values (Wei et al., 2010). Sediment analyses conducted in the Gökova region have revealed that the Risk Index (RI) value exceeds 600 (RI > 600). The analyses indicate that this could pose a significantly high ecological risk to the benthic environment and associated biota. Among the sediments in the Gökova region, Cd has been identified as the primary contaminant responsible for ecological risks. As noted in previous sections, given the Cd poor ophiolitic lithology of the Muğla-Gökova basin, this risk profile is not a result of natural geological weathering.
High RI values indicate the cumulative effect of intense phosphate fertilizer runoff from agricultural land in the region. (Köleli & Kantar, 2006; Saltali et al., 2004). The continuous influx of Cd into these closed freshwater-marine transition zones creates a hazardous environment for the benthic ecosystem (Nziguheba & Smolders, 2008).
RI values exceeding 600 indicate a critical threshold for the Gökova region and point to potentially serious degradation of the biota associated with the benthic community (Hakanson, 1980). When compared with other coastal and river systems in Türkiye and worldwide, the sediments of Gökova exhibit a localised ‘hotspot’ of pollution (Balkis et al., 2010; Oran & Erginal, 2023).
3.5. Correlation Analysis to Different metals in the sediments
Spearman correlation analysis is provided in the Table 8. In water, Cd shows strong positive monotone associations with Fe (ρ = 0.78, p < 0.01) and Cu (ρ = 0.60, p < 0.01), and a moderate Fe-Cu association (ρ = 0.47, p < 0.01) is also detected. A separate moderate correlation is observed between Mn and Zn (ρ = 0.53, p < 0.01), while these two metals show no significant association with the Fe-Cu-Cd group (|ρ| ≤ 0.18, p > 0.05). The water correlation matrix therefore exhibits a two-block structure. In sediment, all pairwise correlations are positive, and Fe is significantly correlated with each of the other four metals (ρ between 0.51 and 0.57, p < 0.01), making it the most centrally connected variable. Moderate significant correlations are also observed between Cu and Cd (ρ = 0.54, p < 0.01), Cd and Zn (ρ = 0.49, p < 0.01) and Cu and Zn (ρ = 0.48, p < 0.01), whereas Mn shows weaker and non-significant associations with Cd (ρ = −0.10) and Zn (ρ = 0.33).
|
Table 8. Spearman rank correlation matrix for heavy metals in water and sediment samples from the Gökova region. |
|||||||||||
|
|
Water |
Sediment |
|||||||||
|
|
Fe |
Cu |
Mn |
Cd |
Zn |
|
Fe |
Cu |
Mn |
Cd |
Zn |
|
Fe |
1 |
|
|
|
|
Fe |
1 |
|
|
|
|
|
Cu |
0.472** |
1 |
|
|
|
Cu |
0.512** |
1 |
|
|
|
|
Mn |
0.182 |
-0.039 |
1 |
|
|
Mn |
0.543** |
0.238* |
1 |
|
|
|
Cd |
0.782** |
0.600** |
0.152 |
1 |
|
Cd |
0.260* |
0.540** |
-0.102 |
1 |
|
|
Zn |
0.089 |
-0.121 |
0.527** |
0.082 |
1 |
Zn |
0.574** |
0.484** |
0.328** |
0.493** |
1 |
|
*The correlation is significant at 0.05. **The correlation is significant at 0.01. |
|||||||||||
PCA was performed on log-transformed and standardized (z-scored) data. The first two components jointly explain 77.2 % of the total variance for water and 76.9 % for sediment. Loadings ≥ |0.7| are considered strong contributors to the corresponding component.
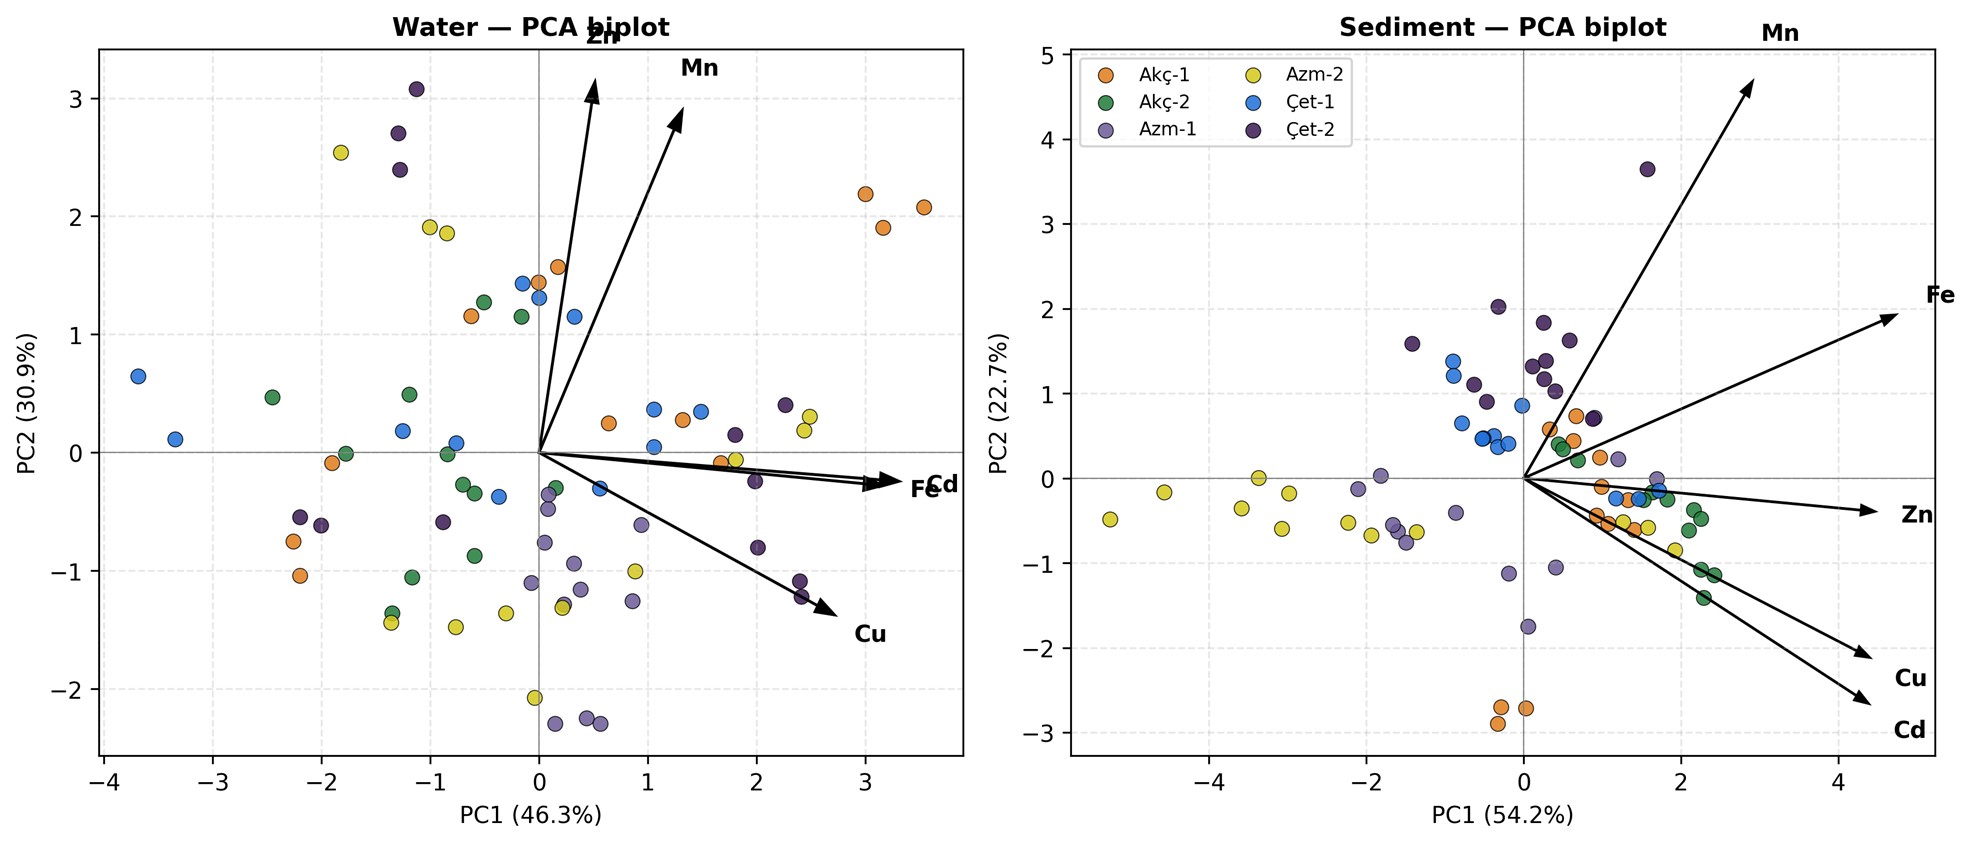
For water, the first two principal components jointly account for 77.2 % of the total variance (PC1 = 46.3 %, PC2 = 30.9 %). PC1 is dominated by high positive loadings of Cd (0.92), Fe (0.88) and Cu (0.76), while Mn and Zn contribute only weakly to this component (0.37 and 0.14, respectively). PC2 is defined almost exclusively by Zn (0.87) and Mn (0.81), which both load weakly on PC1. The two components therefore separate the five water variables into two non-overlapping groups. For sediment, the first two components explain 76.9 % of the total variance (PC1 = 54.2 %, PC2 = 22.7 %). PC1 shows uniformly high positive loadings for all five metals (Fe = 0.83, Zn = 0.78, Cu = 0.77, Cd = 0.77, Mn = 0.51), indicating that the dominant mode of variability is shared among the metals. PC2 contrasts Mn (0.82) and Fe (0.34) against Cd (-0.47) and Cu (-0.37), splitting the metals into two opposing subsets along the second axis. In both biplots, samples from station Akç-2 are located at the positive extreme of PC1, in agreement with the Kruskal–Wallis results reported in Table 9.
|
Table 9. Principal Component Analysis (PCA) of heavy metal concentrations in water and sediment. Loadings (correlation of each metal with the component) and percentage of variance explained are reported for the first two components. |
||||
|
|
Water |
Sediment |
||
|
Metal |
PC1 |
PC2 |
PC1 |
PC2 |
|
Fe |
0.879 |
-0.078 |
0.830 |
0.338 |
|
Cu |
0.756 |
-0.383 |
0.772 |
-0.371 |
|
Mn |
0.366 |
0.806 |
0.510 |
0.821 |
|
Cd |
0.921 |
-0.068 |
0.769 |
-0.467 |
|
Zn |
0.143 |
0.873 |
0.783 |
-0.069 |
|
Variance explained (%) |
46.3 |
30.9 |
54.2 |
22.7 |
3.6. Human Risk Assessment
The summary of average daily doses (ADDi and ADDd) from sediment metals and the associated non-carcinogenic health risks (HQ, HI) is shown in Table 10. The non-carcinogenic risk was assessed using the Hazard Quotient (HQ) and Hazard Index (HI); here, a value exceeding 1.0 indicates potential adverse health effects because the exposure dose exceeds the Reference Dose (RfD) value (Qu et al., 2012; US EPA, 2015; Zabin et al., 2008). For ingestion exposure (HQingestion), HQ values for Fe (267.31), Mn (552.04), Cu (6.44) and Zn (8.1219) were found to be well above 1.0 for children. Adults also showed high HQ values for Fe (28.64) and Mn (59.14). These results indicate that the digestive tract may pose a significant potential health threat for both age groups, especially for children. In contrast to the ingestion pathway, HQdermal values for all metals showed extremely low accumulation (between 10-2 and 10-7), indicating that skin contact with sediment does not pose a significant non-carcinogenic health risk. The risk burden stems from the accumulation of large amounts of Fe and Mn. The significant difference between age groups indicates that children may face a cumulative risk approximately 9.3 times higher than adults in terms of metal exposure. The risk burden can be attributed to large accumulations of Fe and Mn. The marked difference between age groups shows that children are extremely vulnerable to metal exposure and may face a cumulative risk approximately 9.3 times higher than adults. This study shows that the HQ and HI values calculated for human health indicate that ingestion is the primary route of exposure to sediment-derived contamination, which could pose a serious potential health risk, particularly for children. In a study conducted on sediments in East Saint Martin Island, Bangladesh, the HQ values calculated for ingestion were generally between 10-3 - 10-2, while the total HI values remained at approximately 10-3 for adults and 10-2 for children, indicating that the health risk was below general standards (Bhuyan et al., 2023). Similarly, in a study conducted on sediments at Ras Abu Ali Island (Saudi Arabia), HQ values for both children and adults were calculated to be below 1 for ingestion and dermal contact, while total HI values remained in the 10-2 range and the risk was assessed as low (Al-Kahtany & El-Sorogy, 2023). Furthermore, a study published in the journal Sustainability also stated that HQ values were HQ < 1 for all metals and HI values remained in the range of 10-3 – 10-2 (El Ouaty et al., 2024). Comparisons show that the health risk detected in the sediments of the Gökova Region is significantly higher than the risk reported in many different studies published in the literature.
|
Table 10. Summary of average daily doses ( and ) and associated non-carcinogenic health risks (HQ, HI) from sediment metals. |
||||||||||
|
|
ADDi (mg/kg/day) |
ADDd (mg/kg/day) |
Hazard quotient (HQ) by Ingestion |
Hazard quotient (HQ) by dermal |
||||||
|
Metals |
Children |
Adults |
Children |
Adults |
HQi (children) |
HQi (adults) |
HQd (children) |
HQd (adults) |
||
|
Fe |
13,7475 |
1,4729 |
2,20E-05 |
4,49E-04 |
45,8251 |
4,9098 |
4,89E-04 |
9,97E-03 |
||
|
Cu |
0,0442 |
0,0047 |
3,03E-09 |
1,44E-06 |
1,1052 |
0,1184 |
2,53E-10 |
1,20E-07 |
||
|
Mn |
1,3249 |
0,1420 |
2,12E-06 |
4,32E-05 |
94,6357 |
10,1395 |
1,15E-03 |
2,35E-02 |
||
|
Cd |
0,0192 |
0,0021 |
3,07E-08 |
6,26E-07 |
38,3850 |
4,1127 |
3,07E-03 |
6,26E-02 |
||
|
Zn |
0,4177 |
0,0448 |
6,68E-07 |
1,36E-05 |
1,3923 |
0,1492 |
1,11E-05 |
2,27E-04 |
||
|
HI (Hazard Index) |
181.34 |
19,42 |
4,27E-03 |
9,64E-02 |
||||||
3.7. Carcinogenic Risk Assessment
According to the results of the CR assessment, a CR value less than 10-6 is considered negligible, while a CR value greater than 10-4 indicates a high cancer risk. According to USEPA data, carcinogenic risk calculations were performed only for Cd among the five metals measured (US EPA, IRIS). When examining the total CR (CRtotal) values calculated for Cd (the sum of ingestion and dermal exposure routes), the total CR value calculated for adults (6.71 × 10⁻⁶)falls within the tolerable risk limits of 10-6 to 10-4 established by the US EPA. However, it was determined that the total CR value calculated for children (6.25 × 10⁻⁴) exceeds the acceptable upper limit of 10-4. This risk observed in the region is thought to be due to intensive agricultural activities in the watershed. In particular, it is believed that the use of phosphate fertilizers and uncontrolled pesticide application on agricultural lands in the areas where samples were collected leads to Cd accumulation in coastal sediments via soil erosion and surface runoff. The findings suggest that cumulative Cd exposure could pose a significant cancer risk in the region, particularly for children, a vulnerable group; therefore, both improvements in agricultural management and regular ecotoxicological assessments of the region are necessary.
3.8. Discussion
The heavy metal concentrations detected in sediments of the Gökova Special Environmental Protection Area (SEPA) indicate that the region is under significant anthropogenic pressure. In particular, the negative kurtosis values observed for Cu, Zn, and Cd demonstrate that these metals deviate from natural background levels, forming extreme values (point-source pollution) at specific locations (Beaver et al., 2012).
3.8.1. Literature Comparison and Pollution Level
The findings reveal that the Gökova Basin is experiencing critical pollution, particularly regarding cadmium (Cd). The average Cd value of 8.75 mg/kg is approximately 43 times higher than the values along the Mersin and İskenderun coasts (0.20 mg/kg) and far exceeds the levels in the neighboring Köyceğiz Lagoon System. According to the Richir & Gobert (2016) database, which covers 1,210 stations across the Mediterranean, Gökova falls within the top 2.7 % of the Mediterranean in terms of Cd pollution. The 80-fold difference observed when compared to reference points such as the Çömlekçi Stream highlights the ecotoxicological risk.
3.8.2. Source of Pollution: Agricultural Activities
It is known that the ophiolitic series forming the region’s geology are Cd-poor (Engin et al., 1987). Considering this, the detected accumulation cannot be attributed to geochemical/natural processes, proving that the source is entirely anthropogenic. It is hypothesized that phosphate fertilizers (TSP, DAP, etc.) and pesticides used in the intensive agricultural lands adjacent to the stations are the primary sources leading to Cd transport into sediments via soil erosion and drainage channels (Akçapınar and Azmak) (Wu et al., 2015). The fact that Fe and Cu levels remain similar to those in other reference areas confirms that the contamination is a specific contamination related to agricultural inputs rather than a general metal enrichment.
3.8.3. Health Risk and Protection Strategies
According to the results of the Health Risk Assessment (HI/HQ), the HI value of 181.34 found for Cd is well above the critical threshold of 1. In terms of carcinogenic risk, the calculated total CR value for children 6.25 × 10⁻⁴ exceeds the acceptable upper limit of 10-4, indicating that cumulative exposure in the region could pose a serious health threat. Although Gökova has held Special Area of Conservation (SAC) status since 1988 and is protected under the Barcelona Convention (SPAMI), these findings suggest that this may be a result of inadequate oversight in terrestrial pollution management. It is concluded that current conservation efforts, which focus solely on marine activities, are insufficient. To ensure the future sustainability and protection of the Gökova ecosystem, it has become imperative—given the regional context — to regulate agricultural inputs, monitor the quality of discharged drainage water, and update protection strategies to prevent pollution transport from land to sea, rather than focusing solely on marine measures.
4. CONCLUSION
In conclusion, this study provides a comprehensive assessment of the ecological and human health risks associated with metal pollution in the transition zone of the Gökova Bay. The results reveal that concentrations of many metals, particularly in sediments, exceed established guideline values, indicating that anthropogenic impacts continue to affect the region. Sediment analyses indicate a significant enrichment of Zn and, in particular, Cd compared to background values. Very high CF, EF and Igeo values for Cd, combined with an RI > 600, indicate that cadmium is the primary cause of ecological risk in Gökova sediments. This enrichment can be attributed not to natural lithological weathering, but rather to intense agricultural runoff and the long-term use of phosphate fertilizers in the surrounding catchment area.
A human health risk assessment using exposure parameters (EF = 60 days/year) indicates that ingestion of contaminated sediments poses a significant non-carcinogenic risk, particularly for children. Whilst Fe and Mn contribute significantly to the total risk, the Hazard Quotient (HQ) for Cd also exceeds the 1.0 threshold; this supports Cd’s role as the primary anthropogenic stress factor. A significant difference between age groups reveals that children face a cumulative risk approximately 9.3 times higher than that of adults (HI = 181.34).
Regional assessments indicate that the Akçapınar station, adjacent to the main agricultural drainage outlets of the Gökova Basin, exhibits the highest risk indicators. This spatial distribution is fully consistent with the hydrogeological characteristics of the Akçapınar Stream, which functions as the main discharge point for agricultural surface runoff into the inner bay (Demirak et al., 2006; Dügel & Kazancı, 2004). In particular, the increases in metal concentrations observed during the autumn season support the notion that seasonal rainfall triggers the terrestrial transport of fertiliser residues from the surrounding plains into the benthic environment (Varol & Şen, 2012). In this context, Akçapınar and its surroundings emerge as a critical area for identifying pollution hotspots and developing catchment-based risk management strategies. To more clearly elucidate the potential impacts of the geochemical findings on the ecosystem, it is recommended that future studies be expanded to include ‘biological-based approaches’ such as analyses of benthic community structure and standard ecotoxicological bioassays. Such integrated studies could provide a more comprehensive basis for monitoring the ecological status of the Gökova Bay and managing agricultural inputs.
REFERENCES
- Ahmed, F., Fakhruddin, A.N.M., Imam, M.T., Khan, N., Khan, T.A., Rahman, M.M. & Abdullah, A.T.M., 2016. Spatial distribution and source identification of heavy metal pollution in roadside surface soil: A study of Dhaka–Aricha Highway, Bangladesh. Ecological Processes, 5(1), 2. http://dx.doi.org/10.1186/s13717-016-0045-5.
- Akyol, O., Ceyhan, T., İlkyaz, A. & Erdem, M., 2007. Gökova körfezi (ege denizi) uzatma ağlari balikćiliği üzerine araştirmalar. Anadolu University Journal of Sciences & Technology, 8(1).
- Al-Kahtany, K. & El-Sorogy, A.S., 2023. Contamination and health risk assessment of surface sediments along Ras Abu Ali Island, Saudi Arabia. Journal of King Saud University – Science, 35(2), 102509, https://doi.org/10.1016/j.jksus.2022.102509.
- Bai, J., Cui, B. & Chen, B., 2011. Spatial distribution and ecological risk assessment of heavy metals in surface sediments from a typical plateau lake wetland, China. Ecological Modelling, 222(2), 301–306. https://doi.org/10.1016/j.ecolmodel.2009.12.002.
- Balkis, N., Aksu, A., Okuş, E. & Apak, R. 2010. Heavy metal concentrations in water, suspended matter, and sediment from Gökova Bay, Turkey. Environmental monitoring and assessment, 167(1), 359-370. DOI 10.1007/s10661-009-1055-x.
- Beaver, M.B., Beaver, J.R. & Mendenhall, W., 2012. Introduction to probability and statistics. New Delhi: Cengage Learning.
- Bhuyan, M.S., Haider, S.M.B., Meraj, G., Bakar, M.A., Islam, M.T., Kunda, M., Siddique, M.A.B., Ali, M.M., Mustary, S., Mojumder, I.A. & Bhat, M.A., 2023. Assessment of heavy metal contamination in beach sediments of Eastern St. Martin’s Island, Bangladesh: Implications for environmental and human health risks. Water, 15(13), 2494, https://doi.org/10.3390/w15132494.
- Çiftçi, N., Ayas, D. & Bakan, M., 2020. The Comparison of Heavy Metal Level in Surface Water, Sediment and Biota Sampled from the Polluted and Unpolluted Sites in the Northeastern Mediterranean Sea. Journal of Anatolian Environmental and Animal Sciences, 5(3), 441-450, https://doi.org/10.35229/jaes.745674.
- CLMS, 2018. Copernicus Land Monitoring Service - CORINE Land Cover (CLC) 2018, Europe. European Environment Agency (EEA).
- Davutluoglu, O.I., Seckin, G., Ersu, C.B., Yilmaz, T. & Sari, B. 2011. Assessment of metal pollution in water and surface sediments of the Seyhan River, Turkey, using different indexes. Clean – Soil, Air, Water, 39(2), 185–194, https://doi.org/10.1002/ clen.201000266.
- De Caritat, P., Cooper, M., Jaireth, S. & Bastrakov, E. 2011. National Geochemical Survey of Australia: Preliminary implications for energy and mineral exploration. Geoscience Australia Record, 2011/29.
- Demirak, A., Balci, A. & Tüfekçi, M., 2006. Environmental impact of the marine aquaculture in Güllük Bay, Turkey. Environmental monitoring and assessment, 123(1), 1-12., https://doi.org/10.1007/s10661-005-9063-y.
- Dügel, M. & Kazanci, N., 2004. Assessment of water quality of the Büyük Menderes River (Turkey) by using ordination and classification of macroinvertebrates and environmental variables. Journal of Freshwater Ecology, 19(4), 605-612, DOI:10.1080/02705060.2004.9664741.
- Duodu, G.O., Goonetilleke, A. & Ayoko, G.A., 2016. Comparison of pollution indices for the assessment of heavy metals in Brisbane River sediment. Environmental Pollution, 219, 1077–1091, doi: 10.1016/j.envpol.2016.09.008.
- Duodu, G.O., Goonetilleke, A. & Ayoko, G.A., 2017. Potential bioavailability assessment, source apportionment and ecological risk of heavy metals in the sediment of Brisbane River estuary, Australia. Marine Pollution Bulletin, 117(1–2), 523–531, https://doi.org/10.1016/j.marpolbul.2017.02.017.
- El Ouaty, O., El M’rini, A., Nachite, D., Marrocchino, E. & Rodella, I., 2024. Sediment quality indices for the assessment of heavy metal risk in Nador Lagoon sediments (Morocco) using multistatistical approaches. Sustainability, 16(5), 1921, https://doi.org/10.3390/su16051921.
- Engin, T., Ozkocak, O. & Artan, U., 1986. General geological setting and character of chromite deposits in Turkey, in Chromites. UNESCO’s IGCP-197 Project Metallogeny of Ophiolites: Athens, Greece, Theophastus Publishers, p. 199–228.
- Erdinç, S.Ö., 2010. Water quality investigation of Kadın Creek and Akçapınar Creek that fed Gokova Bay. Turkish. M. Sc. Thesis, Institute of Science and Technology, Muğla University.
- Filgueiras, A.V., Lavilla, I. & Bendicho, C. 2004. Evaluation of distribution, mobility and binding behaviour of heavy metals in surficial sediments of Louro River (Galicia, Spain) using chemometric analysis: A case study. Science of the Total Environment, 330, 115–129, https://doi.org/10.1016/j.scitotenv.2004.03.038.
- Forstner, U. & Wittmann, G.T.W., 1981. Metallic pollution in the aquatic environment. Springer-Verlag, New York, 486 pp.
- Gailer, J., 2007. Arsenic-selenium and mercury selenium bonds in biology. Coordination Chemistry Reviews 251 (1-2), 234-254, 10.1016/j.ccr.2006.07.018.
- Genç, T.O. & Yilmaz, F., 2015. Bioaccumulation indexes of metals in blue crab (Callinectes sapidus Rathbun, 1896) inhabiting specially protected area Köycegiz Lagoon (Turkey). Indian J Anim Sci 85(1):94–99, https://doi.org/10.56093/ijans.v85i1.46197.
- Genthe, B., Le Roux, W.J., Schachtschneider, K., Oberholster, P.J., Aneck-Hahn, N.H. & Chamier, J., 2013. Health risk implications from simultaneous exposure to multiple environmental contaminants. Ecotoxicology and Environmental Safety, 93, 171–179, https://doi.org/10.1016/j.ecoenv.2013.03.032.
- Hakanson, L., 1980. An ecological risk index for aquatic pollution control: A sediment ecological approach. Water Research, 14, 975–1001, https://doi.org/10.1016/0043-1354(80)90143-8.
- Iqbal, J., Shah, M.H. & Akhter, G., 2013. Human health risk assessment of heavy metals in drinking water and food crops: A case study of Pakistan. Environmental Monitoring and Assessment, 185(9), 7455–7468, https://doi.org/10.1007/s10661-013-3104-8.
- Khorshid, M.S.H. & Thiele-Bruhn, S., 2016. Contamination status and assessment of urban and non-urban soils in the region of Sulaimani City, Kurdistan, Iraq. Environmental Earth Sciences, 75(16), 1171, https://doi.org/10.1007/s12665-016-5972-z.
- Köleli, N. & Kantar, Ç. 2006. Fosforlu gübrelerde ağır metal tehlikesi [Heavy metal hazard in phosphate fertilizers]. Ekoloji, 15(59), 1–5.
- Krasnici, N., Dragun, Z., Erk, M. & Raspor, B., 2013. Distribution of selected essential (Co, Cu, Fe, Mn, Mo, Se, and Zn) and nonessential (Cd, Pb) trace elements among protein fractions from hepatic cytosol of European chub (Squalius cephalus L.). Environ Sci Pollut Res, 20:2340–2351, 10.1007/s11356-012-1105-8.
- Kurnaz, A., Duyar, M.A. & Kılıç, Ö., 2022. Temporal and spatial variations of heavy metal concentrations in surface sediments of the Eastern Mediterranean coast of Turkey. Marine Pollution Bulletin, 174, 113264, https://doi.org/10.1016/ j.marpolbul.2021.113264.
- Kutlu, B., 2023. Contamination and Ecological Risk Assessment of Heavy Metals in Surface Sediments of the Munzur Stream, Turkey. Polish Journal of Environmental Studies, 32(1), 587-597, DOI: 10.15244/pjoes/154734.
- Kutlu, B., Çevik, F. & Çetindağ, S., 2025. Assessments of heavy metal contaminations of surface water and sediment of Pülümür Stream (Türkiye). Environmental Forensics, 26(1), 1–15, https://doi.org/10.1080/15275922.2024.2330024.
- Kutlu, B., Özcan, T., & Özcan, G., 2021. Analysis of heavy metal contamination in surface sediments of Iskenderun Bay, Turkey. Oceanological and Hydrobiological Studies, 50(4), 411–420, https://doi.org/10.2478/oandhs-2021-0035.
- Li, Z., Ma, Z., van der Kuijp, T.J., Yuan, Z. & Huang, L., 2014. A review of soil heavy metal pollution from mines in China: Pollution and health risk assessment. Science of the Total Environment, 468, 843–853, https://doi.org/10.1016/j.scitotenv.2013.08.090.
- Liu, M., Zhong, J., Zheng, X., Yu, J., Liu, D. & Fan, C., 2018. Fraction distribution and leaching behavior of heavy metals in dredged sediment disposal sites around Meiliang Bay, Lake Taihu (China). Environmental Science and Pollution Research, 25(10), 9737–9744, 10.1007/s11356-018-1249-2.
- MacDonald, D.D., Ingersoll, C.G. & Berger, T.A., 2000. Development and evaluation of consensus-based sediment quality guidelines for freshwater ecosystems. Archives of Environmental Contamination and Toxicology, 39, 20–31, doi.org/10.1007/s002440010075.
- Martin, J.M. & Meybeck, M., 1979. Elemental mass-balance of material carried by major world rivers. Marine Chemistry, 7, 173–206, 10.1016/0304-4203(79)90039-2.
- Miletić, A., Lučić, M. & Onjia, A., 2023. Exposure factors in health risk assessment of heavy metal (loid) s in soil and sediment. Metals, 13(7), 1266, https://doi.org/10.3390/met13071266.
- Mohiuddin, K.M., Ogawa, Y., Zakir, H.M., Otomo, K. & Shikazono, N., 2011. Trace elements contamination in water and sediments of an urban river in a developing country. International Journal of Environmental Science and Technology, 8, 723–736, https://doi.org/10.1007/BF03326257.
- Müller, G., 1979. The heavy metal pollution of the sediments of the Neckars and its tributary: A stocktaking. Chemiker Zeitung, 105, 157–164.
- NHDES, 2019. Recreational Waters Program: Beach Management and Risk Assessment Guidance. New Hampshire Department of Environmental Services, R-WD-19-11, Concord, NH, USA.
- Nziguheba, G. & Smolders, E., 2008. Inputs of trace elements in agricultural soils via phosphate fertilizers in European countries. Science of the total environment, 390(1), 53-57, 10.1016/j.scitotenv.2007.09.031.
- Öğlü, B., Yorulmaz, B., Genc, T.O. & Yılmaz, F., 2015. The assessment of heavy metal content by using bioaccumulation indices in European chub, Squalius cephalus (Linnaeus, 1758). Carpathian Journal of Earth and Environmental Sciences, Vol. 10, No. 2, p. 85 – 94.
- Okoro, H.K., Orosun, M.M., Umar, S.A. & Muzammil, K., et. al., 2024. Human and Ecological Risk Assessments of Potentially Toxic Elements in Sediments around a Pharmaceutical Industry. Heliyon, 10(11), e31685, https://doi.org/10.1016/j.heliyon.2024.e31685.
- Oran, U. & Erginal, A.E., 2023. Potentially Toxic Element-Induced Ecological Risk Assessment of Kilitbahir Port, Çanakkale, Türkiye. Türkiye Jeoloji Bülteni, 66(2), 211-222, https://doi.org/10.25288/tjb.1220278.
- Pejman, A., Bidhendi, G.N., Ardestani, M., Saeedi, M. & Baghvand, A., 2015. A new index for assessing heavy metal contamination in sediments: A case study. Ecological Indicators, 58, 365–373, DOI:10.1016/j.ecolind.2015.06.012.
- Qu, C., Sun, K., Wang, S., Huang, L. & Bi, J., 2012. Monte Carlo simulation-based health risk assessment of heavy metal soil pollution: A case study in the Qixia Mining Area, China. Human and Ecological Risk Assessment, 18(4), 733–750, doi.org/10.1080/10807039.2012.688697.
- Rether, A., 2002. Entwicklung und Charaktersierung wasserlöslicher Benzoyl thioharnstoff funktionalisierter Polymere zur selektiven Abtrennung von Schwermetallionen aus Abwässern und Prozesslösungen (Doctoral dissertation, Technische Universität München).
- Richir, J. & Gobert, S., 2016. A reassessment of trace element contamination and risk in the Mediterranean Sea based on a sediment quality database. Science of the Total Environment, 541, 582-599, https://doi.org/10.1016/j.scitotenv.2015.10.041.
- Saltali, K., Sari, H., Mendil, D. & Altin, S., 2004. Cadmium and phosphorus accumulates in soil under intensive cultivation in Turkey. Acta Agriculturae Scandinavica, Section B-Soil & Plant Science, 54(4), 267-272, https://doi.org/10.1080/09064710410035721.
- Savci, S., 2012. An agricultural pollutant: chemical fertilizer. International Journal of Environmental Science and Development, 3(1), 77-80, DOI:10.7763/IJESD.2012.V3.191.
- Sturgeon, R.E., 2000. Current Practice and Recent Developments in Analytical Methodology for Trace Metal Analysis of Soils, Plants and Water. Commun. Soil. Sci. Plan., 31(11-14):1479-1512, DOI:10.1080/00103620009370522.
- Suthar, S., Nema, A. K., Chabukdhara, M. & Gupta, S.K., 2009. Assessment of metals in water and sediments of Hindon River, India: Impact of industrial and urban discharges. Journal of Hazardous Materials, 171(1–3), 1088–1095, https://doi.org/10.1016/j.jhazmat.2009.06.109.
- Swarnalatha, K., Letha, J., Ayoob, S. & Nair, A.G., 2015. Risk assessment of heavy metal contamination in sediments of a tropical lake. Environmental Monitoring and Assessment, 187(6), 322, DOI:10.1007/s10661-015-4558-7
- Taylor, S.R. & McLennan, S.M., 1995. The geochemical evolution of the continental crust. Reviews of Geophysics, 33(2), 241–265, https://doi.org/10.1029/95RG00262.
- Tessier, E., Garnier, C., Mullot, J.U., Lenoble, V., Arnaud, M., Raynaud, M. & Mounie, S., 2011. Spatial and historical distribution of sediment inorganic contamination in Toulon Bay (France). Marine Pollution Bulletin, 62(10), 2075–2086, https://doi.org/10.1016/j.marpolbul.2011.07.020.
- Tuna, A. L., and Celik, V., 2009. Agricultural and Domestic Pollution in the Inner Gulf of Gökova, Smap III Gökova Project. Mugla, Turkey: Mugla Sıtkı Koçman University.
- US EPA, 1989. Risk Assessment Guidance for Superfund. Volume I: Human Health Evaluation Manual (Part A). Office of Emergency and Remedial Response, Washington, DC.
- US EPA, 2001. Methods for Collection, Storage and Manipulation of Sediments for Chemical and Toxicological Analyses: Technical Manual. EPA-823-B-01-002. Office of Water, Washington, DC.
- US EPA, 2004. Risk Assessment Guidance for Superfund (RAGS), Volume I: Human Health Evaluation Manual (Part E: Supplemental Guidance for Dermal Risk Assessment). Washington, DC, USA.
- US EPA, 2011. Exposure Factors Handbook: 2011 Edition. National Center for Environmental Assessment, Washington, DC.
- US EPA, 2015. Human Health Risk Assessment Protocol for Hazardous Waste Combustion Facilities. Washington, DC, USA.
- US EPA, 2023. Regional Screening Levels (RSLs): Chemical-Specific Parameters and Toxicity Values Summary Table (November 2023 Update). Washington, DC, USA.
- US EPA IRIS, 2024. Integrated Risk Information System Database. U.S. Environmental Protection Agency.
- Ustaoğlu, F., 2020. Ecotoxicological risk assessment and source identification of heavy metals in the surface sediments of Çömlekci stream, Giresun, Turkey. Environmental Geochemistry and Health, 42, 130-142. DOI:10.1080/15275922.2020.1806148.
- Varol, M. & Şen, B., 2012. Assessment of nutrient and heavy metal contamination in surface water and sediments of the upper Tigris River, Turkey. Catena, 92, 1-10, 10.1016/j.catena.2011.11.011.
- Wei, B., Jiang, F., Li, X. & Mu, S., 2010. Heavy metal induced ecological risk in the city of Urumqi, NW China. Environmental Monitoring and Assessment, 160(1-4), 33-44, DOI:10.1007/s10661-008-0655-1.
- Wu, S., Peng, S., Zhang, X., Wu, D., Luo, W., Zhang, T. & Wu, L., 2015. Levels and health risk assessments of heavy metals in urban soils in Dongguan, China. Journal of Geochemical Exploration, 148, 71e78, DOI:10.1016/j.gexplo.2014.08.009.
- Xiao, Q., Zong, Y. & Lu, S., 2015. Assessment of heavy metal pollution and human health risk in urban soils of a steel industrial city (Anshan), Northeast China. Ecotoxicology and Environmental Safety, 120, 377–385, 10.1016/j.ecoenv.2015.06.019.
- Yabanlı, M., Yozukmaz, A., Şener, İ., Çoker, T., Yapıcı, H. H., & Çetin-Kasa, E., 2021. Heavy Metal Contamination Status and Risk Assessment in Surface Sediments of Köyceğiz Lagoon Estuary System (KLES) (South-West Anatolia). Journal of Anatolian Environmental and Animal Sciences, 6(3), 395-402, https://doi.org/10.35229/jaes.954751.
- Yalçın, M.G. & İlhan, S., 2008. Multivariate analyses to determine the origin of potentially harmful heavy metals in beach and dune sediments from Kizkalesi coast (Mersin), Turkey. Bulletin of Environmental Contamination and Toxicology, 81(1), 57-62, 10.1007/s00128-008-9461-2.
- Yildiz, D., Atasoy, M. & Arslan, Y., 2024. Ultra-trace determination of mercury by platinum-coated tungsten coil trapping cold vapour atomic absorption spectrometry. International Journal of Environmental Analytical Chemistry, 104(17), 1-13, 10.1080/03067319.2022.2118591.
- Yorulmaz, B., Yılmaz, F. & Genç, T.O., 2015. Heavy metal concentrations in European eel (Anguilla anguilla L., 1758) from Köyceğiz-Dalyan lagoon system. Fres. Environ. Bull, 24(5), 1607-1613.
- Zabin, S.A., Foaad, M.A. & Al-Ghamdi, A.Y., 2008. Non-carcinogenic risk assessment of heavy metals and fluoride in some water wells in the Al-Baha Region, Saudi Arabia. Human and Ecological Risk Assessment, 14(6), 1306-1317, 10.1080/10807030802494667.