1. INTRODUCTION
Environmental pollution by petroleum substances is a long-term problem in both developing and developed countries of the world. Crude oil and petroleum products leak during the processes of their extraction, transport, processing, as well as during their use by end consumers. They are present at various types of sites - refineries, large-volume storage facilities, pipelines, fuel stations, chemical production facilities (CL:AIRE, 2014; Weiner, 2012). The presence of petroleum substances in soils and groundwater poses a serious risk to the environment and human health, and therefore the maximum permissible concentrations of petroleum hydrocarbons in soils and groundwater are part of the legislation of the Slovak Republic. Historically, determinations of concentrations of non-polar extractable compounds (NEC), which can be determined in the infrared spectrum (NEC-IR, corresponding to US EPA 418.1 method) or the ultraviolet spectrum (NEC-UV, corresponding to Slovak Technical Norm 83 0540-4), have been used to detect the content of petroleum substances. These are group determinations that do not allow the identification of individual components, moreover, both methods have their limitations (NEC-IR is focused on aliphatic components, NEC-UV on aromatic components, both methods are problematic in identifying volatile components (Samešová & Ladomerský, 2006; Zemo, 2016). Currently, the above analytical methods are replaced in practice and in legislation by the gas chromatography (GC) method. Its advantage is the focus on pollution of oil origin with the possibility of identifying selected hydrocarbon fractions. In EU countries, groundwater pollution is assessed according to the Water Framework Directive (WFD) – Directive 2000/60/EC and the Groundwater Directive – Directive 2006/118/EC. The detection of petroleum hydrocarbon content is defined by standard EN ISO 9377-2, which is based on gas chromatography with flame ionization detector. The results of the analyses are crucial in legal disputes concerning groundwater pollution. However, even when using gas chromatography, it is not possible to exclude a negative influence on the results of chemical analyses of oil substances in groundwater (overestimation of detected concentrations). The results of commonly performed analyses can be influenced by several groups of substances. The first are biogenic organic substances that occur naturally in the natural environment (Lundegard & Sweeney, 2004). The second group is the degradation products (metabolites) of petroleum substances (Zemo & Foote, 2003) and the last group is polar components naturally occurring in crude oil (Lundegard & Knott, 2001).
1.1. Distinguishing between petroleum and non-petroleum compounds
The term “Natural Organic Matter” (NOM) is often used to describe naturally occurring organic compounds derived from plants, animals and microorganisms (also called biogenic organic compounds). It can also consist of a number of biochemical precursors of non-petroleum origin, such as carbohydrates (polysaccharides, monosaccharides), proteins, peptides, lipids, aminosaccharides, lignins and tannins (Lang, 2011). Isoprenoid alkenes, straight-chain alkenes and long-chain alkanes from plant waxes and microalgae are the most abundant natural hydrocarbons in sediments (Volkman et al., 1992). In sediments and soils, they often have a similar structure to petroleum hydrocarbons (Dahl et al., 2019). The concentrations of biogenic organic compounds alone may exceeded the regulatory limits, with soil samples recording contents of up to 1300 mg kg-1 (Wang et al., 2012). The presence of NOM is characterized by a group of indistinct peaks in the range C20-C36 (Corban & Cooney, 2022). At a site with an exceptionally large oil spill, sediment samples were monitored for petrogenic and biogenic hydrocarbons after more than 20 years. Background samples showed a characteristic presence of biogenic hydrocarbons in the range C21-C33 (Wang & Fingas, 2005). Practical experience in two laboratories has shown that in many cases the use of GC often led to the detection of hydrocarbons, the source of which was largely NOM (usually in the range of 50 - 500 mg kg-1). These were mainly peat samples containing a large amount of extractable organic matter that is not removed by silica gel cleanup (SGC). Positive responses in the area of total petroleum hydrocarbons (TPH) were also obtained in samples of upper soil horizons, with medium to elevated organic matter contents, the occurrence of which is associated with soil-forming processes (Corban & Cooney, 2022).
The composition of a petroleum hydrocarbon mixture can be significantly altered by degradation processes, the products of which include polar substances. The dominant process is usually biodegradation (Kaplan, 2003), producing, for example, organic acids/esters, alcohols, ketones, phenols and aldehydes (Zemo et al., 2013). The degradation products, due to their polar nature, preferentially dissolve in groundwater. The solubility of hydrocarbons in the middle distillate range is low in water, so biodegradation has a greater impact on the extent of pollution than dissolution by groundwater flow (Christensen & Larsen, 1993).
The toxic effects of biogenic organic components and degradation products have not been studied in detail, and opinions on their toxicity vary. Some authors consider them less toxic compared to petroleum hydrocarbons (Zemo et al., 2013), while others consider them to be of unknown risk (Bruckberger, 2020). Multiple examples in scientific literature show that metabolites can be more toxic than parent compounds. Carcinogenic risk of vinyl chloride, presenting final product of tetrachloroethene decomposition, is higher than of the parent compound (Steenson et al., 2016). An important aspect is the persistence of pollution by petroleum substances in the environment. The longer a substance is exposed to external influences (weathering, biodegradation), the more likely it is that mixtures will contain not only the original petroleum hydrocarbons, but also their degradation products. If the identified pollution concentrations exceed legislative criteria, their detection may lead to the implementation of geological works (geological survey, risk analysis of the contaminated area, remediation). Therefore, the distinction of the nature of pollution has its justification from the point of view of the management of contaminated areas, with a significant economic aspect.
In order to obtain the most accurate results, in the case of groundwater pollution by petroleum hydrocarbons, it is recommended to include in the set of analytical works the removal of polar substances from the sample. Silica gel (e.g. Florisil of U.S. Silica Company) is an adsorbent that is used to extract polar substances from the sample, so it is possible to determine the content of non-polar and polar substances. It is produced from sodium silicate and sulfuric acid (silicic acid), where the resulting product is a regenerative adsorbent of silica with weakly acidic properties. The first part of the sample is analyzed directly, the second after adsorption on silica gel, the resulting difference should correspond to the content of polar substances (ITRC, 2010). The above procedure is recommended by works and methodologies aimed at evaluating the possibilities of detecting petroleum hydrocarbons (CRC CARE, 2017; Zemo, 2016), as well as by the laboratories themselves (ALS, 2024). Laboratory practice has shown that the results of the analyses may include unwanted substances even after sample treatment with silica gel. Corban & Cooney (2022) identified in the treated samples not only biogenic organic components (alpha-pinene, beta-pinene, phellandrene), but also traces of PCBs, pesticides and sewage components (cholestanol, squalene, cholestanone, stanols).
The authors of the paper participated on geological tasks, which were aimed at the identification and removal of petroleum products from the geological environment (soil and groundwater). During the implementation of the tasks, GC analyses of groundwater samples were performed, in which all samples were analyzed as native and subsequently after the removal of any polar substances with SGC. The results of the analyses allowed a more detailed view of the nature and change in the extent of pollution at selected environmental burdens in Slovakia.
2. MATERIALS AND METHODS
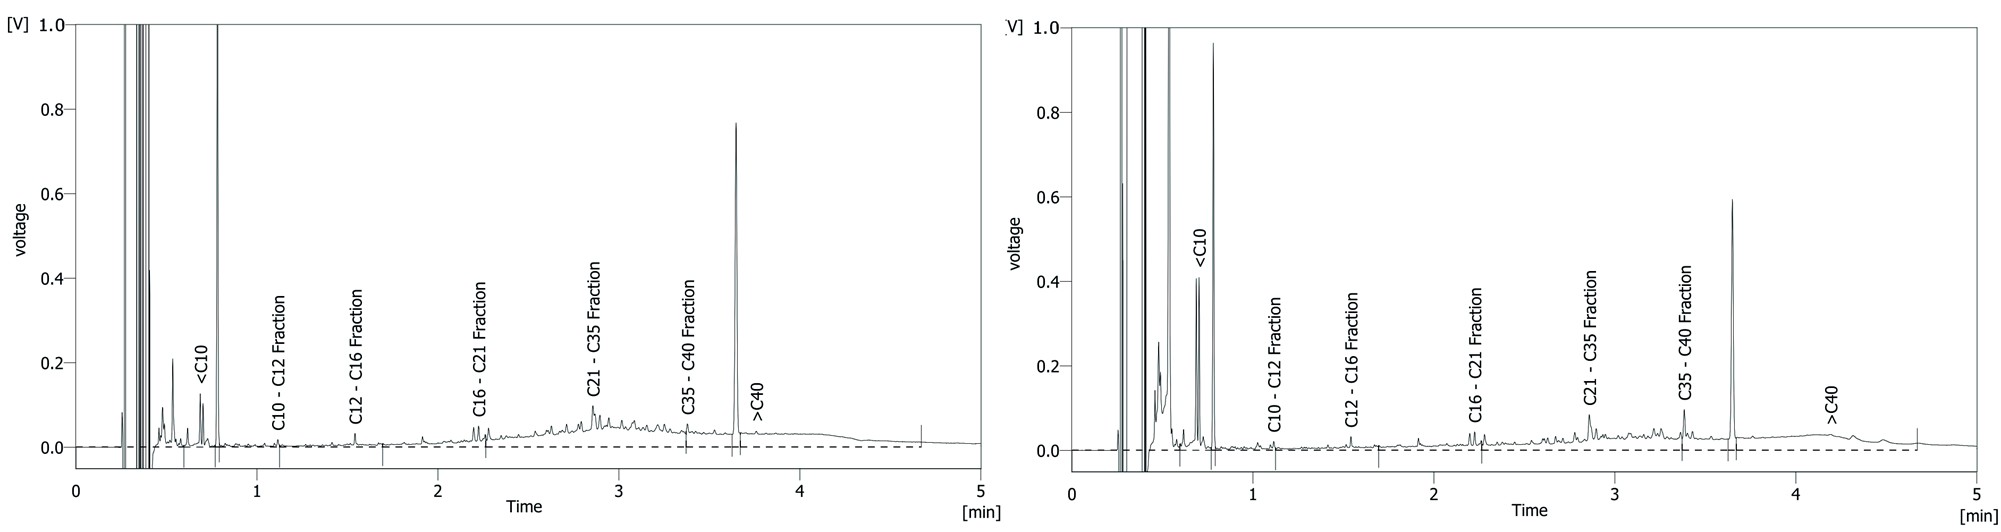
The paper presents the results of geologic tasks from three sites, where pollution by petroleum products was identified (environmental burdens origination in years 1975-2005). The aim is to identify polar compound content in groundwater samples containing petroleum hydrocarbons. Samples were taken from wells using a 12V pump, with stagnant water being pumped out of the well before collection. Samples were taken into 500 mL bottles with PTFE caps. After collection, the filled sample containers were placed in a cooling box and transported to the laboratory within 4 hours. Samples preservatives were not used. In some samples, the hydrocarbon content was high and a free product layer was formed in the sample container during transport to the laboratory (ALS Slovakia, Ltd.). In this case, the analyses were carried out from the aqueous phase and the samples were analyzed as native and subsequently after removal of polar substances with silica gel. The above-mentioned working procedure is commonly called silica gel cleanup (SGC). GC-FID (Gas Chromatography with Flame Ionization Detector) analyses were performed in accordance with the US EPA 8015 and US EPA 3510 methodology. Chromatograms assigned to the analytical results visually prove the presence of polar substances in the samples, or their decrease after SGC. The course of the chromatograms is divided into four intervals (C10 -C12; C12 - C16; C16 - C35; C35 - C40). Chromatograms are original analytical outputs. The graphic outputs show the intervals of individual fractions marked in the graphical outputs, with the text in some cases overlapping with the chromatograph curve. This problem is a result of the analytical device settings, and any additional correction by the authors could negatively affect the consistency of the record. The Y axis corresponds to the signal intensity, expressed either in amperes (A) or volts (V). However, the different units do not affect the results; they are only different software settings. In GC-FID measurements, the decrease in ionization current is recorded either in nA or V units. The area is then given as mV·s or pA·s, which is an identical result.
3. RESULTS AND DISCUSSION
3.1. Site 1 - Štúrovo
Site 1 (environmental burden NZ (029) / Štúrovo - locomotive depot (Cargo), samples A - H) represents a railway site - a former locomotive depot - which has been out of service since 2008. The site has undergone remediation and the pollution at the site has been reduced below the level posing a risk (Urban et al., 2021). Groundwater samples were collected during the remediation.
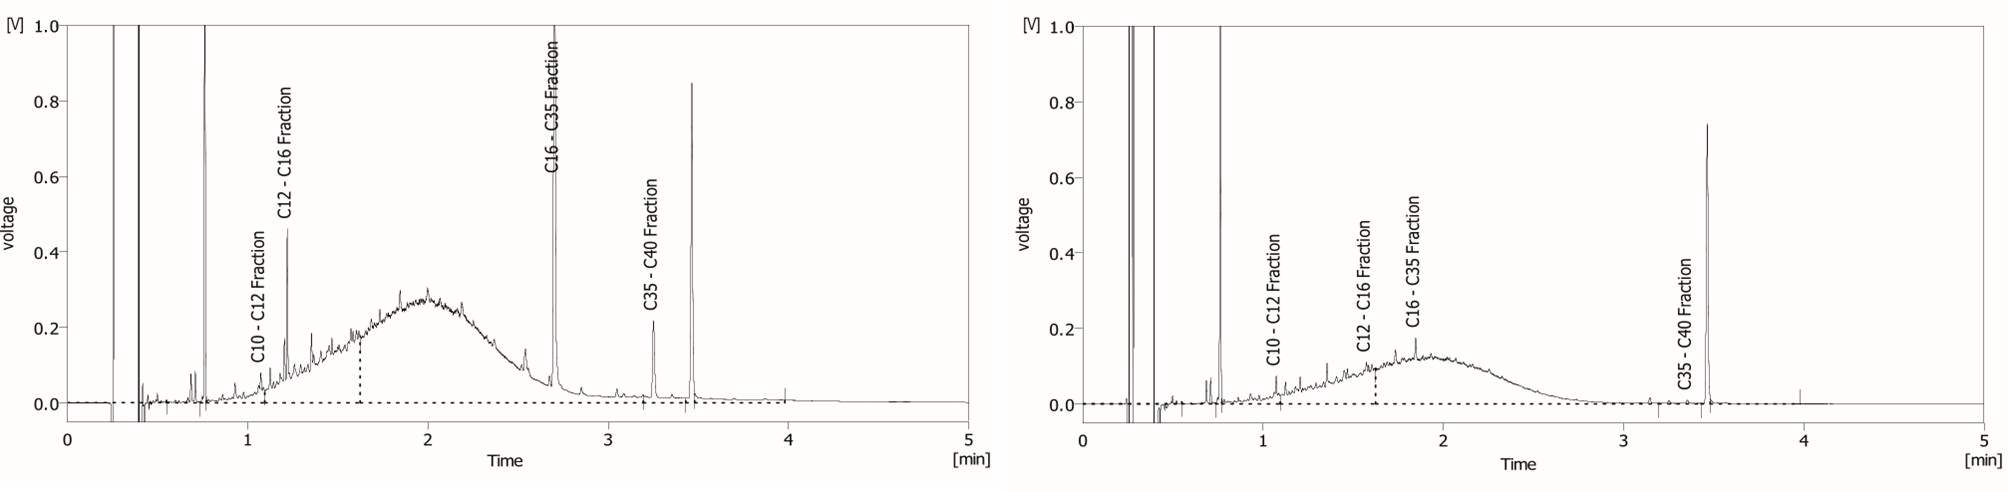
Sample A (Figure 1) shows a significant reduction in the pollution content, while the chromatographic record of the sample is characterized by a reduction in the unresolved complex mixture (the so-called "hump" under the peaks - unresolved complex mixture, UCM), without significant identification of specific substances. Compared to the native sample, low peaks in the C30 - C40 region were eliminated, and in the C10 - C30 region they were reduced.
In sample B (Figure 2), after SGC, there was an order of magnitude decrease in the pollution content (89.2 %). The highest pollution decrease was also in the C16 - C35 fraction (96.3 %). The highest pollution concentrations moved from the C16 - C35 fraction to the C12 - C16 fraction.
No significant differences were observed between the native and purified samples in sample C (Figure 3). The detected concentration of pollution was even higher than in the native sample after removal of polar substances. The reason may be the removal of polar substances (NOM, alcohols, etc.) that could have masked the hydrocarbon signal in the native sample and reduced the detector response. but within the laboratory's declared measurement uncertainty (+- 30 %).
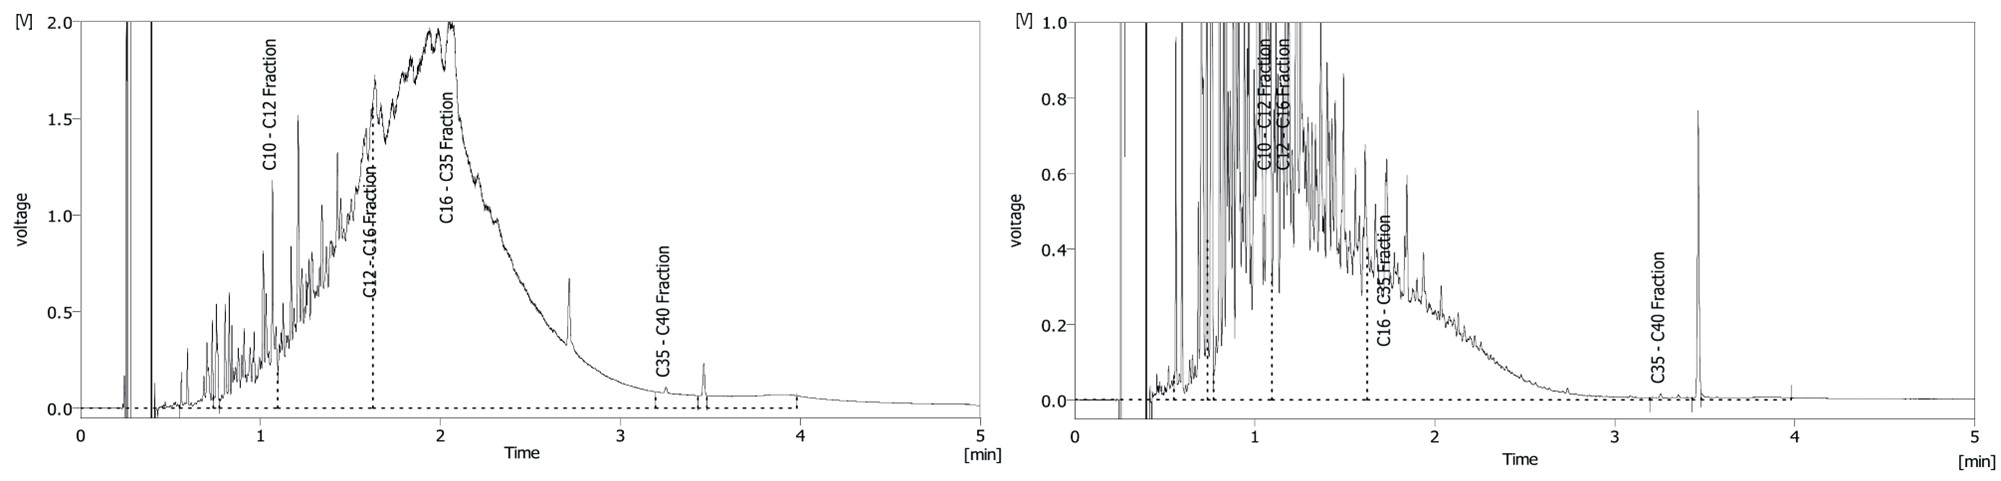
Free product was present in sample D (Figure 4), which affected the analysis result – the concentration in the sample before SGC is significantly higher than the solubility of petroleum substances in water.


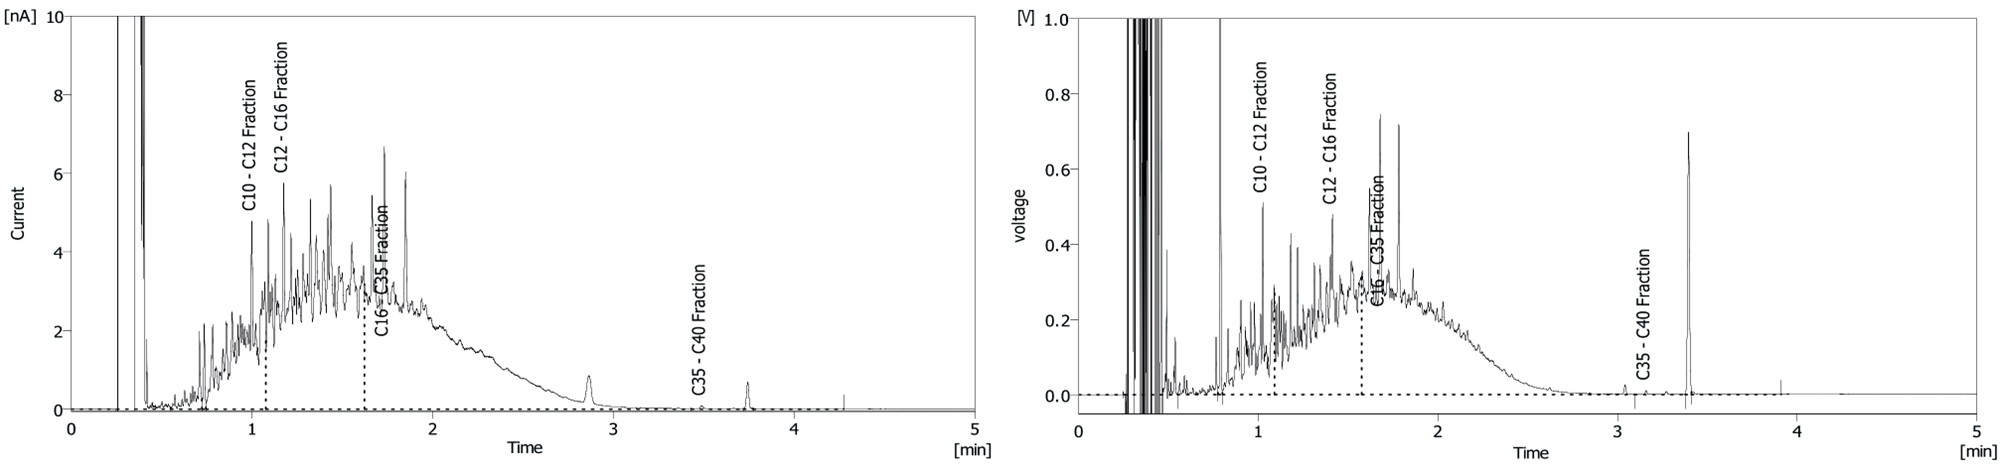
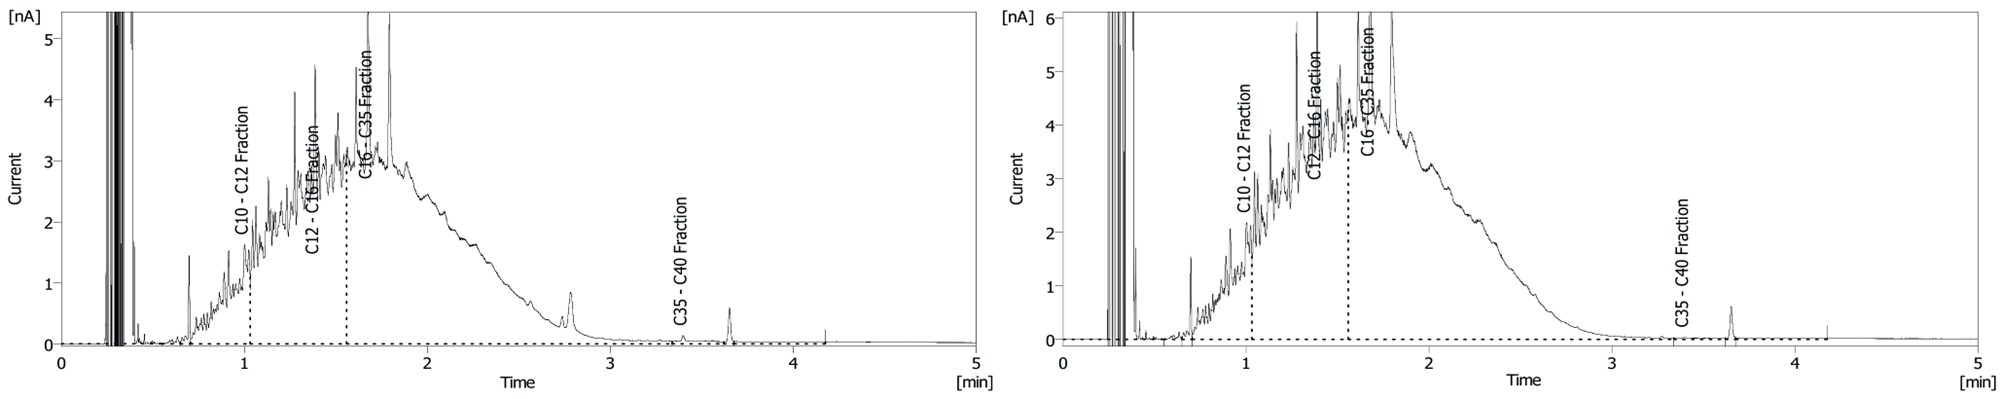
In sample E (Figure 5), the pollution concentrations decreased by 31.8 %. In terms of individual fractions (with the exception of C35 - C40, the concentration of which was lower than the detection limit of the method in the purified sample), there was essentially an approximately equal decrease, ranging from 19.7 to 35.5 %.
SAMPLE F (Figure 6), the pollution concentrations decreased by 65 %. In terms of individual fractions (with the exception of C35 - C40, the concentration of which was lower than the detection limit of the analytical method in the SGC treated sample), there was essentially an approximately equal decrease, ranging from 58.8 to 71 %.
In sample G (Figure 7), the petroleum hydrocarbons content after SGC was higher than in the native sample. The sample was probably free of polar substances, the difference is within the measurement uncertainty reported by the laboratory (+- 30 %). Another reason could be, as stated in sample C, removal of polar substances that masked petroleum hydrocarbon signal.
In sample H (Figure 8), specific changes in the nature of the pollution resulting from SGC are visible. In the native sample, there are distinct peaks in the range of C20 - C35, which, based on the results of other works, should correspond to the content of substances of non-petroleum origin. After SGC, these substances are completely removed, while the initial part of the chromatogram (up to C16) remained without significant changes.


In some cases, the presented analytical records have different scales (e.g. sample C, Figure 3). Visually, this may indicate a different level of contamination, however, when considering the scale of the two records, it is clear that the Y-axis waveforms are almost identical (as are the detected C10-C40 concentrations).
3.2. Site 2 - Leopoldov
Site 2 (environmental burden HC (1844) / Leopoldov - locomotive depot, Cargo a.s., samples I - K) represents an active railway site (locomotive depot) in limited service. The site was remediated and the pollution at the site was reduced below the level posing a risk (Tupý et al., 2022). In all three samples, the application of SGC resulted in a significant reduction of pollution. In all three samples, the largest percentage decrease was recorded in the C16 - C35 fraction. The highest was in sample J (Figure 10), at 98.8 %. There was a significant decrease in the other fractions C10 - C12 (82.4 %), C12 - C16 (95.3 %) and C35 - C40 (89.6 %). The shape of the K sample chromatogram after SGC (Figure 11) indicates a different nature of pollution compared to samples I (Figure 9) and J. Given the assumed nature of pollution (diesel and lubricating oils), we evaluate the increased UCM in the C20 - C35 range in this sample as a result of a higher proportion of oils in the sample.


3.3. Site 3 – Bratislava – Ružinov – Čierny les
Site 3 (environmental burden B2 (004) / Bratislava - Ružinov - Čierny les, samples L - N) represents an uncontrolled waste dump. In the past, waste of various origin (municipal, construction, industrial) was dumped into the former gravel pit, with thickness reaching up to 10 m. The site is currently undergoing remediation. In two analyzed groundwater samples, significant differences in the resulting concentrations before and after sample treatment were identified. The content of substances of non-petroleum origin in the samples was significant, in samples without treatment it was higher than the value of legislative criteria. In sample L, no clear changes in the chromatograms were identified, the removal of polar substances only reduced the UCM. In sample M after SGC, a significant peak at approximately the C21 level is absent, which shows the removal of a specific pollution component. In the third sample N, a similar decrease in the total concentration of pollution of approximately 25 % was observed (which is within the stated measurement uncertainty of +- 30 %). The more pronounced peaks in the C16 region were removed, as well as the smaller peaks from the C21 - C35 interval.


When dividing the results of sample analyses by fractions, pollution was most abundant in the C16 - C35 fraction. This is due both to the type of pollution (middle distillates - diesel, lubricating oils), as well as to the widest range of the given fraction among the four evaluated. Differences in native samples, as well as after performing SGC, are obvious. Variability in pollution can be large even within one site, which is the result of natural environmental influences and pollution degradation. Clear presence of non-petroleum compounds is evident in samples from all three sites, and it does not depend on the pollution concentration. A significant decrease in concentrations, caused by the removal of polar substances, was observed in samples with low (500 - 1,000 µg L-1) as well as high (10,000 - 70,000 µg L-1) pollution concentrations in the native sample. In most cases, changes are not evident in specific peaks or fractions, but there is an overall decrease in UCM. Detailed changes in the chromatographic record are most visible in sample H. The presented results are the outputs of low-resolution analyses. For better identification, it is more appropriate to use analyses with a longer retention time and higher resolution. However, low-resolution analyses are sufficient for initial orientation.
For samples with high concentrations of petroleum hydrocarbons, it is necessary to count on a higher degree of uncertainty, which is caused by the possible presence of a phase in the samples. The sites from which the groundwater samples were taken are characterized by a long-term high degree of pollution. During the sample collection by pumping, the water and oil phases could have mixed. The oil phase would then be separated again during the transport of the sample to the laboratory.
The results show various forms of development of pollution content in groundwater. It is obvious that the use of SGC has its justification. It allows to remove unwanted substances from the sample in a simple way, which affect the outputs of chemical analyses and their interpretation. Primary identification of the presence of polar substances can be carried out by means of chromatograph evaluation. Another option is to verify the background content of polar substances in a water sample taken above the presumed source of pollution (against the direction of groundwater flow).
We recommend that the identification of polar substances in groundwater samples, which in commonly performed analyses have shown the presence of hydrocarbons in the C10 - C40 range, be carried out on at least one batch of samples when carrying out a geological task. As is evident from the presented results, that a significant reduction in pollution concentrations can occur after SGC. The result of the analysis will more accurately reflect the content of petroleum hydrocarbons and enable better evaluation of the sample in terms of legislative pollution levels. The pollution concentration is one of the input values when performing the risk analysis of a polluted area, or it can serve for the overall classification of a site during monitoring. The essential benefit of SGC is obtaining more accurate data on the quality and quantity of pollution, because it removes substances from the sample that affect the detection of petroleum hydrocarbons (NOM, esters, fatty acids, alcohol, surfactants). Risk assessment is questionable in the case when concentrations of polar substances are the dominant element of pollution. The methodology for assessing their potential toxicity is not used in practice. One option could be, for example, the implementation of ecotoxicological analyses using aquatic organisms.
4. CONCLUSIONS
In the paper, we presented the results of analyses comparing the concentrations of petroleum substances in groundwater samples from three sites before and after the removal of polar substances. As follows from the discussion, there are significant differences in the results even within one site. Despite these differences, which can be basically easily identified and interpreted in connection with the type of pollution and the characteristics of the rock environment, it is obvious that the use of silica gel cleanup has its justification in the implementation and evaluation of geological tasks.
Acknowledgements
Data presented in this paper were collected during remediation of three environmental burdens, carried out as a part of the projects “Remediation of selected environmental burdens in the Slovak Republic (1) – part 3” and „Remediation of environmental burdens at selected sites in the Slovak Republic (6)“ (implemented with financial support of the European Union from Cohesion Fund in frame of Operational programme Quality of Environment. We are also grateful to the Centre of Environmental Services, Ltd. (Bratislava) and Envislovakia, NGO (Bratislava), for taking part in financing this research.
REFERENCES
- ALS, 2024. Resolving False Positive Detections of Petroleum Hydrocarbons Originating from Natural Organics. EnviroMail / Europe, no. 14, March, ALS Laboratories.
- Bruckberger, M., 2020. Degradation of recalcitrant products from weathered petroleum contaminations in Western Australia and Kuwait (Doctoral Thesis). The University of Western Australia, https://doi.org/10.26182/5ee2fcedb8307
- Christensen, L.B. & Larsen, T.H., 1993. Method for Determining the Age of Diesel Oil Spills in the Soil. Groundwater Monitoring & Remediation, 13, 142–149, https://doi.org/10.1111/j.1745-6592.1993.tb00458.x
- CL:AIRE, 2014. An Illustrated Handbook of LNAPL Transport and Fate in the Subsurface. Contaminated Land: Applications in Real Environments.
- Corban, G. & Cooney, T., 2022. Detection of Natural Organic Matter in the Total Petroleum Hydrocarbon Method. WasteMINZ Virtual Summit 2022, 9-11.5.
- CRC CARE, 2017. Weathered Petroleum Hydrocarbons (Silica Gel Clean-up) (Technical Report No. 40). Newcastle: CRC for Contamination Assessment and Remediation of the Environment.
- Dahl, M., Survo, S., Välitalo, P., Kabiersch, G., Alitalo, O.-S., Penttinen, O.-P. & Rantalainen, A.-L., 2019. Identification of Toxicants from a Highly C10–C40-Contaminated Sediment Influenced by the Wood Industry: Petroleum Hydrocarbons or Biogenic Organic Compounds? Environmental Toxicology and Chemistry, 38, 936–946, https://doi.org/10.1002/etc.4380
- ITRC, 2010. Use and Measurement of Mass Flux and Mass Discharge. Interstate Technology & Regulatory Council. Integrated DNAPL Site Strategy Team.
- Kaplan, I.R., 2003. Age Dating of Environmental Organic Residues. Environmental Forensics, 4, 95–141, https://doi.org/10.1080/15275920303495
- Lang, D.A., 2011. Characterisation of polar unresolved complex mixtures in groundwater associated with weathered petroleum (PhD. Thesis). Curtin University of Technology.
- Lundegard, P. & Knott, J., 2001. Polar Organics in Crude Oil and Their Potential Impacts on Water Quality. Proceedings of the Petroleum Hydrocarbons and Organic Chemicals in Groundwater—Prevention, Detection, and Remediation Conference and Exposition, 14-16.11.
- Lundegard, P. & Sweeney, R.E., 2004. Total Petroleum Hydrocarbons in Groundwater—Evaluation of Nondissolved and Nonhydrocarbon Fractions. Environmental Forensics, 5, 85–95, https://doi.org/10.1080/15275920490454346
- Samešová, D. & Ladomerský, J., 2006. Výskyt a stanovenie ropných látok v povrchových vodách. Život. Prostr., 40, 84–87.
- Steenson, R., Hellmann-Blumberg, U., Elias, D., Brown, K., Fry, N., Naugle, A., Meillier, L. & Prowell, C., 2016. Petroleum metabolites (Literature review and assessment framework). San Francisco Bay Regional Water Quality Control Board.
- Tupý, P., Schwarz, J., Antal, J., Masiar, R., Filo, J., Jasovský, Z., Moravčík, D., Fickuliaková, M., Drábik, A., Macek, J., Brutenič, M., Benko, J., Kostolanský, M., Jurkovič, Ľ., Kravchenko, D. & Malý, V., 2022. Sanácia environmentálnej záťaže HC (1844) / Leopoldov - Rušňové depo, Cargo a.s. (SK/EZ/HC/1844) (Final report with risk assessment). EBA, s.r.o., ODOS, s.r.o., ENVIGEO, a.s., Bratislava.
- Urban, O., Chovanec, J., Keklák, V., Gregor, T., Kolářová, J., Vybíral, V., Škarvan, A., Čopan, J., Drábik, A., Macek, J., Jurkovič, Ľ., Kostolanský, M., Benko, J., Malý, V., Kravchenko, D., Tóth, R. & Brutenič, M., 2021. Sanácia environmentálnej záťaže NZ (029) / Štúrovo - Rušňové depo, Cargo a.s. (SK/EZ/NZ/601) (Final report with risk assessment). DEKONTA Slovensko, spol. s r. o., DEKONTA, a. s., Bratislava.
- Volkman, J.K., Holdsworth, D.G., Neill, G.P. & Bavor, H.J., 1992. Identification of natural, anthropogenic and petroleum hydrocarbons in aquatic sediments. Sci Total Environ 112, 203–219, https://doi.org/10.1016/0048-9697(92)90188-x
- Wang, Z. & Fingas, M., 2005. Oil and Petroleum Product Fingerprinting Analysis by Gas Chromatographic Techniques. Chromatogr. Sci. Ser. CRC Press, pp. 1027-1101, https://doi.org/10.1201/9781420027983.ch27
- Wang, Z., Yang, C., Yang, Z., Hollebone, B., Brown, C.E., Landriault, M., Sun, J., Mudge, S.M., Kelly-Hooper, F. & Dixon, D.G., 2012. Fingerprinting of petroleum hydrocarbons (PHC) and other biogenic organic compounds (BOC) in oil-contaminated and background soil samples. J Environ Monit, 14, 2367–2381, https://doi.org/10.1039/c2em30339f
- Weiner, E.R., 2012. Applications of Environmental Aquatic Chemistry: A Practical Guide. Third Edition, CRC Press, Boca Raton, https://doi.org/10.1201/b12963
- Zemo, D.A., 2016. White Paper: Analytical Methods for Total Petroleum Hydrocarbons (TPH). Prepared for American Petroleum Institute.
- Zemo, D.A. & Foote, G.R., 2003. The Technical Case for Eliminating the Use of the TPH Analysis in Assessing and Regulating Dissolved Petroleum Hydrocarbons in Ground Water. Groundwater Monitoring & Remediation 23, 95–104, https://doi.org/10.1111/j.1745-6592.2003.tb00687.x
- Zemo, D.A., O’Reilly, K.T., Mohler, R.E., Tiwary, A.K., Magaw, R.I. & Synowiec, K.A., 2013. Nature and Estimated Human Toxicity of Polar Metabolite Mixtures in Groundwater Quantified as TPHd/DRO at Biodegrading Fuel Release Sites. Groundwater Monitoring & Remediation, 33, 44–56, https://doi.org/10.1111/gwmr.12030