1. INTRODUCTION
A water-bearing capacity index and at the same time a measure of the rock abundance is the underground runoff, which is one of the components of the total runoff recorded in the river. This parameter is formed mainly in the upper parts of the rock massif, which includes the fractured zones and residual crevices with the weathering cover. This part of the rock profile, due to its higher permeability, is easily accessible for rainwater infiltrating deeper parts of the rock at different times, depending on the presence of crevices and faults. In polar areas, the presence of permafrost poses a significant obstacle to water flow into the rock mass. A key factor controlling shallow groundwater circulation in polar regions is the presence of the so-called active layer — an upper ground layer situated directly above permafrost, which thaws seasonally during summer and refreezes in winter. The thickness of this layer is poorly investigated and may be highly variable (Kasprzak et al., 2017).
This article characterizes the hydrogeological parameters of the active layer, which are governed by the near-surface section of the profile and, in consequence, determine the development of groundwater outflow within the catchment area. Field studies were conducted in the area of Steinvik's catchment in SW Spitsbergen (Figure 1).
2. STUDY AREA
The catchment area of the 2.3-kilometer-long Steinvik stream is located in the south-western part of Spitsbergen, in the coastal area of the Greenland Sea between the Hans Glacier, which leads to the Hornsund Fjord, and the Werenskiold Glacier. The all-year-round polar station is named after Stanisław Siedlecki of the Polish Academy of Sciences, and located near the Hans Glacier in the Polar Bear Bay, while the summer polar station of the Wrocław University is located near the frontal moraine of the Werenskiold Glacier. This base, commonly called Baranówka, was the author's research base during fieldwork.
The climate of the area is marked by relatively low mean annual temperatures (–2.1°C) and scarce precipitation, averaging 422 mm per year. The recorded values fluctuate from as little as 230 mm in a dry year (1987) to as much as 635 mm in a wet year (1996). A stable snow cover typically develops in the second half of September and usually persists until early June (Kwaczyński 2003; Przybylak & Araźny, 2006). Throughout most of the year, snowfall represents the prevailing type of precipitation (Marszałek et al. 2013).
Considering the shape of the catchment area, there is a visible variation in slope of the typically mountainous upper part to the flattened lower part in the coastal zone of the Greenland Sea. The upper part of the catchment, with heights reaching 643 m above sea level, is characterized by steep slopes descending towards the small Steinvik valley, clearly marked in the landform. The stream falls off a steep rocky threshold into the area of a leveled littoral coastal platform (Strandflat) at the elevation between 4 and 25 m above sea level. On land, the platform is bordered by the well-marked, concave bend of the slope of Gulichsenfjellet mountain massif. The platform consists of a well-developed, stepped system of raised marine terraces whose existence is related to the relatively fast post-glacial isostatic uplift of south Spitsbergen (Jahn, 1959; Karczewski et al., 1981). At the mouth of the Steinvik valley, marine pebbles were identified at quite considerable altitudes exceeding 100 m above sea level (Jahn, 1959; Chmal, 1987). Kasprzak (2012) also found them at the altitude of 205 m above sea level, beneath the mantle of slope solifluction deposit (Migoń & Kasprzak, 2013). From the seaside, the study area is a pebble-stone beach with stormbanks, located mainly at the southern mouth of the stream. The value of the absolute height is 643 m for the catchment area and 390 m for the river. The average height for the Steinvik catchment is 321.5 m with an average slope inclination of 42.67%.
In the lower part of the catchment area, at the outlet of the valley from the morphological threshold, there is a distinct form in the shape of an alluvial fan. An attempt to explain the origin of this form was made by Kasprzak (2012), who put forward a thesis about the existence of a water reservoir in the eastern part of the valley, with an area of about 1 km2 and the bottom located at about 250 m above sea level. Due to dynamic factors, rapid emptying of the lake in higher parts of the valley led to the deposition of a cone. The deposits forming the cone, occurring in the form of a complex of Glacier stripes in an area of over 0.5 km2, cover the older accumulation forms (Kasprzak, 2012) (Figure 1).
3. GEOLOGICAL STRUCTURE AND HYDROGEOLOGICAL CONDITIONS
The examined catchment area is located within the Caledonian structural zone (Smulikowski, 1968). Steinvik is composed of Proterozoic metamorphic formations, belonging to several crystalline rock formations (Orvin, 1940; Czerny et al., 1993). The coastline of the Greenland Sea is characterized by the occurrence of white and green quartzites which also appear in the NE mountainous part of the catchment area, together with the mica schists, metarhyolites, quartzites, and laminated quartz-feldspar schists. Amphibolites occupy the central and southern largest part of the catchment area with basalt enclaves and acidic plutonic rocks (Figure 1). Different types of plutonic rock enclaves are formed as separate layers of stratified amphibolites (Czerny et al., 1993; Majka, 2006). Amphibolite rocks are mainly found as aphanitic and fine-blastic varieties. The fragmentary south-western part of the catchment is made of feldspar quartzites with amphibolite layers. In quartzites, potassium feldspar is predominant over plagioclase.
The formations which are crucial in the described research consist of mainly young Quaternary sediments of glacial, river, and sea origin, as well as covers of the weathered crystalline rocks, especially common in the mountainous part of the catchment area. The weathering covers, formed mainly as a result of intensive physical weathering, bear characteristics of rock debris fields, commonly covering slopes of the surrounding rock massifs. The active layer's thickness remains largely unexplored and varies considerably. This is primarily due to the fact that deep boreholes have typically been located at considerable distances from the coastline (Etzelmüller et al., 2011), whereas those drilled within the coastal zone have often been too shallow to capture the full range of thermal and hydrogeological conditions (Chmal & Sobik, 1988). Similarly, studies of the active layer based on traditional surface methods have proven insufficient for characterizing its spatial variability in areas affected by marine processes. Some data have been provided by geophysical investigations conducted in the Steinvik catchment, where the thickness of the active layer was estimated to range from 0.5 to 2.0 meters (Kasprzak et al., 2017). In the upper parts of the area, due to significant slopes and alpine relief of the mountain ridges, their thickness is reduced to zero. The suspension part of the Steinvik valley is covered by dense or scattered boulder formations with solifluction material displaced on the slopes. It possesses features of mixed rubble material stuck in the clay cover of the slope. Larger amounts of rubble material in the form of landfill cones accumulate at the foot of corrosive gutters, while the suspended character of the Steinvik valley causes the accumulation of an inflow cone at its runoff, built of relatively well permeable crumble pieces. The flat area of the lower parts of the basin in question is mostly covered by marine terrace sediments developed in the form of thick gravel and pebbles, with poorly developed settlements of modern river accumulation superimposed on them.

The inability to drill, due to environmental restrictions resulting from the protective character of the area and technical difficulties, did not allow for detailed profiling of the cover formations during fieldworks. Certain information is provided only by shallow trenches made during fieldwork in the area of terraces located on the Strandflat platform.
Due to its nature and the fact that it is built of crystalline rocks, the Steinvik catchment area can be treated as a separate hydrogeological structure in which there is a continuity of local flow, from supply zones to water accumulation zones to drainage zones. The flow depth is limited by the permafrost zone present at a relatively shallow level (approx. 2 m). In the catchment area, there are pore waters in crumbling formations filling the bottoms of river valleys, seaside terraces, and in weirs of crystalline rocks, such as crack waters in metamorphic formations. In the shallow contact zone of cracked rock massifs and weirs, there is a mixed type of pore and fissure water. For the research, the most important role is played by loose formations in the form of weatherings of crystalline rocks and sedimentary crumbles of river, glacial and marine origin.
In the Steinvik's catchment area, as in other polar areas, three primary zones of groundwater occurrence can be distinguished (Haldorsen et al., 1996; Haldorsen & Heim, 1999):
- the waters of the active layer of permafrost (suprapermafrost reservoir)
- waters occurring within the permafrost (intrapermafrost reservoir)
- groundwaters under permafrost (subpermafrost reservoir)
However, no indications of deeper groundwater flow, such as a subpermafrost aquifer, have been observed within the study area (Modelska & Buczyński, 2023). In the active layer of permafrost located closest to the surface of the earth, water flows during the polar summer.
4. METHODS
Field measurements and research works were carried out in the polar summer of 2011-2012. In the field, vertical hydraulic conductivity of the surface rock formations was measured using the Porchet method, often used in aquiclude formations. During the research, 26 measurements of the hydraulic conductivity of water were carried out. Measurement of this value consisted of making and pouring water into a trench with a diameter of 10 cm and depth of about 60 cm and measuring the time of water table fall. In this method, three consecutive floods are made, as a result of which output data are obtained to assess the infiltration capacity of the soil. The vertical hydraulic conductivity of the surface layer kz was calculated using appropriate formulas included in Pleczynski’s work (1981):

where:
𝜑(𝑥1) = r/2 (logx1 + r/2)
𝜑(𝑥2) = r/2 (logx2 + r/2)
∆𝑡 = t2 – t1
k – hydraulic conductivity (m/s -1);
x1, x2 – the height of the water table above the bottom of the hole (m);
t1, t2 – time of lowering the water table from x1 to x2 (s);
r – the drilled hole diameter (m).
To estimate the velocity of water flow in the active permafrost layer in the Steinvik catchment area, the marker method with NaCl and fluorescein dye was applied. Measurement of electrolytic conductivity (EC) of water was performed using calibrated multi-parameter WTW 340, with the accuracy of 0.1 µS/cm.
As part of the laboratory tests, a sieve analysis was performed to determine the grain size distribution of the collected rock samples. Analyses were conducted following published guidelines (Myślińska, 2001) in the Laboratory of Soil Mechanics, Institute of Geography and Regional Development, Wrocław University. Grain-size analysis was performed on oven-dried samples (105 ± 5 °C) until a constant mass was achieved. The material was then sieved through a stack of sieves with decreasing mesh sizes mounted on a mechanical shaker. Sieving time was 10 min. The mass of particles retained on each sieve was determined to the nearest 0.01 g, and the percentage of each fraction relative to the total sample mass was calculated. The results were presented as a particle size distribution curve.
5. RESULTS AND DISCUSSION
The water flow in the active layer is mainly determined by the permeability of the rocks which build the near-surface zone. Therefore, 26 measurements of the vertical hydraulic conductivity kz using the Porchet method were carried out in the catchment area. Most of the measurements were feasible in the central and lower part of the catchment (Figure 2). Large dispersion of kz values from 0.005 to more than 131 m/d was obtained (Table 1). Nevertheless, in the vast majority of cases, namely at 20 points, the value was less than 1 m/d. The mean value of kz from 26 measurements was 7.05 m/d. However, having rejected the two highest values, a much lower mean value of vertical hydraulic conductivity kz of 1.33 m/d was obtained. Weathered metamorphic rocks covering the slopes in the mountainous part of the catchment have significantly higher permeability, yet it is challenging to measure due to the coarse-grained material. The material in the lower part of the catchment area also demonstrates high anisotropy, which translates into differences in filtration parameters of the rocks building the active layer. High permeability values (probably of the order of several dozen to several hundred m/d) have thick gravels of sea terraces and river valleys. These measurements were confirmed by the permeability of surface formations of coastal terraces made in a strip of the coastline of the Greenland Sea, limited by the catchment areas of the Brategg and Revelva streams, which gave an average value of 42.3 m/d (Marszałek et al., 2013).

|
Table 1. Results of measurements of vertical permeability of subsurface formations kz using Porchet method and the specific yield µ from the Bieciński formula (1960). |
||||||||||||||
|
Point no. |
1 |
2 |
3 |
4 |
5 |
6 |
7 |
8 |
9 |
10 |
11 |
12 |
13 |
|
|
Elevation |
metres a.s.l. |
12,5 |
15 |
17,5 |
20,5 |
19 |
21 |
32 |
25 |
23 |
21 |
17 |
12,5 |
10 |
|
kz |
m/d |
0,1 |
0,34 |
0,09 |
0,3 |
0,21 |
0,29 |
0,85 |
0,32 |
0,29 |
0,13 |
5E-04 |
0,43 |
0,36 |
|
µ (-) |
0,084 |
0,1 |
0,083 |
0,098 |
0,094 |
0,098 |
0,114 |
0,099 |
0,098 |
0,087 |
0,039 |
0,103 |
0,101 |
|
|
Point no. |
14 |
15 |
16 |
17 |
18 |
19 |
20 |
21 |
22 |
23 |
24 |
25 |
26 |
|
|
Elevation |
Metres a.s.l. |
7 |
8 |
11 |
19,5 |
29 |
27 |
35 |
213 |
205 |
231 |
222 |
233 |
262 |
|
kz |
m/d |
36,31 |
0,7 |
1,94 |
131,6 |
2,07 |
2,49 |
0,05 |
0,02 |
0,79 |
0,54 |
1,09 |
1,88 |
0,03 |
|
µ (-) |
0,195 |
0,111 |
0,129 |
0,235 |
0,13 |
0,133 |
0,076 |
0,07 |
0,113 |
0,107 |
0,118 |
0,128 |
0,071 |
|
Calculated using the Bieciński formula (1960), based on Porchet's measurements of kz values, the permeability of µ of near-surface formations entered within a wide range from 0.039 to 0.235, the average being 0.108 (-) (Table 1).
A significant scattering of the hydraulic conductivity and gravity drainage capacity values results from the difference in the grain size of the crumbles which make up the surface of the active layer of the permafrost layer.
Taking the average hydraulic conductivity k=7.05 m/d determined from the field measurements of the near-surface formations of the active layer and its thickness m amounting to 1.6 m, the transmissivity T equal to 11.28 m2/d was calculated. This value enters the average (III) class of transmissivity, according to the Krásný classification (1993). Not taking into account the coarse-grained seawater formations, the measurement in the aeration zone may lower the value of T. Therefore, the obtained result is treated merely as an indication.
In order to assess the depth variation of permeability of the active layer formations, soil samples were collected from the piezometer P. Granulometric analyses of 6 samples collected every 10 cm down to the depth of 0.6 m were performed. In two samples (PS5 and PS6), apart from the granulometric analysis, a pipette analysis was also carried out, which allowed to separate silt and clay fractions in them (Figure 3). A granulation diagram for individual depth zones in the profile indicates a decrease in the size of grains in the ground along with their depth. The samples from PS2 to PS5 can be classified as gravel, in which the amount of gravel fraction decreases with depth and the amount of sandy fraction increases. At the depth of approx. 60 cm, there are already sands with gravel (Figure 3, 4).
Pipette analyses of selected soil samples collected from the near-surface zone of the catchment in places where permeability measurements were carried out confirm a significant percentage of fine fractions often occurring in the highest parts of the rock profile. Of the six samples examined, three were classified as sandy silt and the others represented loamy sand, silty clay and clay. The highest silt fraction (78.7%) was found in sample S-17, which was characterized as silty clay. A silt fraction above 50% was recorded in sample S-9 (clay). Samples S-13, S-18, S-20 are sandy silt, where the highest content of sand fraction is in the range 45-52%. In one of the tested samples (S-16) sand fraction is above 60%.
The presented examples of strong fractional differentiation of rock formations constituting the active layer are connected with the specificity of its formation in polar conditions. The surface of the Steinvik catchment area, especially in the tundra part located on elevated sea terraces, is characterized by the presence of microrelief in the form of slight elevations and depressions. Within local depressions, the presence of water is responsible for sedimentation of fine material. Moreover, in this catchment area, similarly to other parts of the Arctic, there are geomorphological formations in the form of structural soils. Apart from the oval shape, their characteristic feature is presence of different fractions, from very fine (clay) to coarse (stony) ones. Such a sculpture favors the formation of a mosaic of soils in the subsurface zone, ranging from gravel to sandy and silty (Kabała & Korabiewski, 2013). As a result, the lithological formation of the active layer is characterized by a considerable anisotropy significantly affecting the paths and directions of the existing groundwater flow.


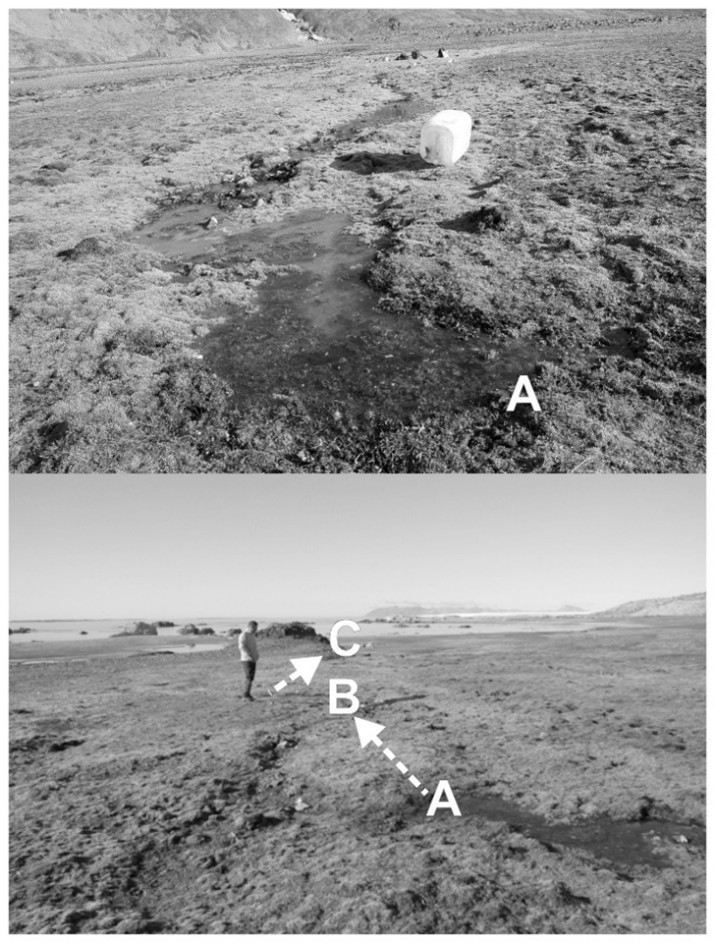
At times, the observed surface water escapes into the rocky subsoil in the coastal plain zone. Marker methods were used in the two abovementioned zones to measure the water flow velocity in the active layer. (Figure 5, 6; Table 2). The application of NaCl solution colored with fluorescein of EC equal to 125 mS/cm as a marker allowed to determine the water flow velocity in the near-surface zone of crumbles. The average value of vertical hydraulic conductivity in the active layer, determined for sections A-B and B-C, with lengths of 7.5 and 28.7 m, respectively, was very high and amounted to 31.39 m/h, i.e. 753.36 m/d. Such high water flow velocities confirm the presence of very well permeable zones in the coastal zone. They consist of coarse-grained material and are adjacent to the zones with a high content of fine fractions: clay and silt. This confirms significant anisotropy in the formation of the active layer. The zones of coarse-grained material are privileged courses of groundwater flow in the permafrost active layer.

|
Table 2. Results of tracer measurements in the permafrost active layer in the marine terraces area. |
|||||
|
section A - B |
section B - C |
||||
|
Time [minutes] |
Electrolytic conductivity [µS/cm] |
Time [minutes] |
Electrolytic conductivity [µS/cm] |
Time [minutes] |
Electrolytic conductivity [µS/cm] |
|
0 |
58 |
8’55” |
430 |
0 |
58 |
|
3’4” |
59 |
9’26” |
459 |
36’2” |
61 |
|
3’5” |
60 |
10’25” |
461 |
37’45” |
63 |
|
3’55” |
61 |
11’15” |
430 |
38’5” |
65 |
|
4’ |
62 |
11’55” |
411 |
40’3” |
70 |
|
4’1” |
65 |
12’08” |
390 |
43’55” |
80 |
|
4’25” |
70 |
12’35” |
380 |
48 |
90 |
|
4’35” |
75 |
13’ |
350 |
49’2” |
110 |
|
4’45” |
80 |
13’38” |
340 |
51’4” |
145 |
|
4’55” |
85 |
13’58” |
320 |
52’4” |
155 |
|
5’05” |
90 |
14’3” |
300 |
54’4” |
180 |
|
5’15” |
95 |
15’35” |
280 |
56’12” |
190 |
|
5’25” |
100 |
16’42” |
250 |
58’ |
200 |
|
5’33” |
105 |
19’3” |
210 |
63’5” |
210 |
|
5’43” |
110 |
22’4” |
105 |
65’1” |
220 |
|
5’5” |
115 |
25’45” |
90 |
74’3” |
218 |
|
5’55” |
120 |
27’1” |
80 |
77’31” |
213 |
|
6’1” |
130 |
34’3” |
76 |
79’05” |
210 |
|
6’25” |
150 |
39’4” |
70 |
82’07” |
200 |
|
6’32” |
170 |
47’05” |
66 |
85’2” |
190 |
|
6’44” |
180 |
53’45” |
64 |
88’33” |
180 |
|
6’53” |
190 |
58’45” |
63 |
91’26” |
170 |
|
6’59” |
204 |
68’4” |
62 |
96’37” |
160 |
|
7’16” |
250 |
76’15” |
61 |
99’24” |
150 |
|
7’45” |
295 |
80’4” |
60 |
102’5” |
140 |
|
8’13” |
350 |
112’5” |
59 |
106’04” |
130 |
|
8’33” |
390 |
|
|
110’47” |
120 |
Taking the value kz =7.05 m/d obtained from the measurements of the vertical hydraulic conductivity and the average thickness of the active layer m=1.6 m, a low transmissivity T of 11.28 m2/d is obtained. However, taking a higher value of k = 42.3 m/d from measurements made by other authors in this part of Spitsbergen (Marszałek et al., 2013), the transmissivity T increases to 67.7 m2/d. According to the Krásný (1993) classification, in zones with very well permeable marine sediments, the T-value can be high (>100 m2/d) or even very high (>1000 m2/d).
6. CONCLUSIONS
The article presents the results of research carried out in the years 2011-2012. Among other things, the studies were focused on the recognition of hydrogeological parameters and their influence on the water-bearing capacity of the research area. The paper presents results of 26 measurements of vertical hydraulic conductivity using the Porchet method and Pleczynski's formulas (1981). The vertical velocity of groundwater flow was experimentally determined using the marker method with NaCl and fluorescein. Among the laboratory methods used were sieve and pipette analyses.
Based on the performed measurements, it can be concluded that the hydraulic conductivity of crystalline rock weatherings and cover formations in the Steinvik catchment area varies considerably.
In the lowlands, where, as a result of low temperatures, selection of coarse-grained material takes place, characteristic formations are formed in the form of so-called structural soils. In such forms, polygonal structures rubble wreaths with crushed stone fractions surround a very fine silty loam material. The permeability of the active layer varies from very low (even 0.005 m/d) values of hydraulic conductivity to over 130 m/d (mean 7.05 m/d) which is similar to results obtained in Brattegg catchment area (0.0005-345.6 m/d) (Wąsik et al., 2023). Thick gravels of marine terraces and river valleys may be characterized by very high (even several hundred m/d) values of this parameter.
Water flow velocities in the near-surface zone of crumbs were determined by using fluorescein-tinted NaCl solution as a marker. The average value of the horizontal filtration speed in the active layer was 753.36 m/d. This confirms a significant anisotropy in the formation of the active layer. Additionally, the zones of coarse-grained material constitute privileged groundwater flow paths in the permafrost active layer.
REFERENCES
- Bieciński P.A., 1960. A new method of determining a specific yield of aquifers. Hydrotechnika i Melioracija, 1960 (6). Sofia.
- Chmal H., 1987. Pleistocene sea level changes and glacial history of the Hornsund area, Svalbard. Polar Research, S n.s., 269–270.
- Chmal H. & Sobik M., 1988. Glaciology. In: Brazdil R., Konečny M. and Prošek P. (eds.) Results of investigations of the geographical research expedition Spitsbergen 1985. Folia Facultatis Scientiarum Naturalium Universitatis Purkynianae Brunensis. Geographia 24. Univerzita J/E/ Purkyne v Brne.
- Czerny J., Kieres A., Manecki M. & Rajchel J., 1993. Geological map of the SW part of Wedel Jarlsberg Land, Spitsbergen (1:25 000). AGH Publishing, Kraków.
- Etzelmüller B., Schuler T.V., Isaksen K., Christiansen H.H., Farbrot H. & Benestad R., 2011. Modeling the temperature evolution of Svalbard permafrost during the 20th and 21st century. Cryosphere 5, 67–79.
- Haldorsen S., Heim M. & Lauritzen S.E., 1996. Subpermafrost groundwater, western Svalbard. Nordic Hydrology, 27 (1-2), 57-68.
- Haldorsen S. & Heim M., 1999. An Arctic Groundwater System and its dependence upon climatic change: An example from Svalbard. Permafrost and Periglacial Processes, 27 (1-2), 10: 137-149.
- Jahn, A., 1959. The raised shorelines and beaches in Hornsund and the problem of postglacial vertical movements of Spitsbergen. Przegląd Geograficzny, 31.
- Kabała C. & Korabiewski B., 2013. Środowisko geograficzne otoczenia Stacji Polarnej im. Stanisława Baranowskiego – Lodowiec Werenskiolda: Gleby. In: Zwoliński, Z., Kostrzewski, A. & Pulina, M. (eds), Dawne i współczesne geoekosystemy Spitsbergenu. Polskie badania geomorfologiczne, Bogucki Wydawnictwo Naukowe, Poznań, 114–118.
- Karczewski A., Kostrzewski A. & Marks L., 1981. Raised marine terraces in the Hornsund area (northern part), Spitsbergen. Polish Polar Research, 2(1–2), 39–50.
- Kasprzak M., 2012. Morfometria, formy i osady Doliny Steinvik (SW Spitsbergen). In: Krawczyk, E. & Styszyńska, A. (eds), Streszczenia referatów i posterów, XXXIV Sympozjum Polarne, Sosnowiec, 84.
- Kasprzak M., Strzelecki M.C., Traczyk A., Kondracka M., Lim M. & Migała K., 2017. On the potential for a bottom active layer below coastal permafrost: the impact of seawater on permafrost degradation imaged by electrical resistivity tomography (Hornsund, SW Spitsbergen). Geomorphology 293, part B, 347–359
- Krásný J., 1993. Classification of transmissivity magnitude and variation. Groundwater 31 (2).
- Kwaczyński J., 2003. Meteorological Yearbook Hornsund 2001/2002. Publications of the Institute of Geophysics Polish Academy of Sciences: D-60.
- Majka, J., 2006. Monazite dating results from the S part of Wedel Jarlsberg Land, Svalbard. Mineralogia Polonica, Special Papers, 28, 139–141.
- Migoń P. & Kasprzak M., 2013. Środowisko geograficzne otoczenia Stacji Polarnej im. S. Baranowskiego – Lodowiec Werenskiolda: Rzeźba. [in:] Zwoliński Z., Kostrzewski A., Pulina M., (red.): Dawne i współczesne geoekosystemy Spitsbergenu. Polskie badania geomorfomologiczne. Bogucki Wydawnictwo Naukowe, Poznań: 104-114.
- Marszałek H., Staśko S., & Wąsik M., 2013. Ocena odpływu podpowierzchniowego w rejonie Hornsundu (SW Spitsbergen). Biuletyn Państwowego Instytutu Geologicznego, 456, 391–396.
- Modelska M. & Buczyński S., 2023. Hydrodynamics and hydrogeochemistry of the Werenskiold glacier forefield (SW Spitsbergen). Polish Polar Research 44: XX–YY. doi: 10.24425/ppr.2023.144540
- Myślińska E., 2001. Laboratory soil research. Wydawnictwo Naukowe PWN, Warszawa (in Polish).
- Orvin A.K., 1940. Outline of the geological history of Spitsbergen. Skrifter om Svalbard og Ishavet, 78, 57 pp.
- Pleczyński J., 1981. Renewal of groundwater resources. Wydawnictwa Geologiczne, Warszawa (in Polish).
- Przybylak R. & Araźny A., 2006. Climatic conditions of the north–west part of Oscat II Land (Spitsbergen) in the period between 1975 and 2000. Polish Polar Research 27: 139–152. doi: 10.2478/v10190-010-0001-10.
- Smulikowski W., 1968. Some petrological and structural observations in the Hecla Hoek succession between Werenskioldbreen and Torellbreen, Vestspitsbergen. Studia Geologica Polonica, 21(6), 97–161.
- Wąsik M., Marszałek H. & Rysiukiewicz M., 2023. Permeability of active layer sediments and groundwater runoff in Brattegg River catchment, SW Spitsbergen. Polish Polar Research, vol. 44 no. 2, pp. 197–219, 2023.