1. INTRODUCTION
In arid and semi-arid regions, the scarcity, irregularity, or absence of surface water elevates groundwater to the status of an indispensable and strategic resource for all uses. In Algeria, this dependence is particularly critical in regions such as Biskra, located on the northern edge of the Sahara, where the phreatic aquifer is often the sole source of water for drinking, industrial, and agricultural purposes (Guergazi et al., 2005; Sedrati, 2011; Attoui et al., 2024). Over recent decades, this reliance has further intensified due to the combined effects of expanding irrigated perimeters, population growth, and rapid urbanization. This intensive and often unregulated exploitation inevitably leads to major consequences, including a pronounced decline in piezometric levels, hydrochemical imbalances, and a progressive degradation of the resource's quality (Ammar et al., 2013; Fehdi, 2009).
Faced with these challenges, understanding local aquifer systems has become a priority. The work of Sedrati (2008) provided valuable insights through the application of geophysical methods to determine the extent of the aquifers in the Biskra region. Subsequently, studies, including those by Sedrati (2011), focused on examining contamination mechanisms and the hydrogeological functioning of the Terminal Complex, specifying its boundary conditions and physico-chemical characteristics. More recently, research has shifted towards a systematic quality assessment. The work of Bouchemal (2015, 2022) and Sedrati (2020) aims to characterize the hydrochemical properties of the water to determine its suitability for consumption and irrigation. With a similar objective, Masmoudi et al. (2024) seek to assess water quality to propose practical solutions for optimizing resource management. These quality alterations are further exacerbated by an unfavorable climatic context, marked by reduced natural recharge, low precipitation, and rising average temperatures (Remini & Achour, 2014).
Within this framework, monitoring and assessing groundwater quality using modern and robust tools has become imperative for integrated and sustainable management. Traditional approaches are now being complemented by interdisciplinary methods that incorporate advanced techniques. Multivariate statistical analysis, numerical processing of geochemical data, and Geographic Information System (GIS) mapping have emerged as central tools. Their power lies in their ability to handle data complexity, establish correlations between multiple physico-chemical and environmental parameters, and thereby reveal trends and potential sources of contamination in a spatially explicit manner.
It is within this context that the present study is situated, with the following primary objectives:
- To characterize the physico-chemical quality of the groundwater in the Biskra region through a sampling campaign and detailed laboratory analysis.
- To assess the suitability of this water for human consumption and agricultural irrigation using specific indices.
- To develop thematic quality and pollution maps using a GIS, enabling precise spatial identification and clear visualization of high-risk areas.
- Ultimately, this research aims to provide managers, farmers, and scientists with a solid decision-making foundation for implementing effective strategies to protect and optimize the management of this vital resource.
2. MATERIALS AND METHODS
2.1. Study area
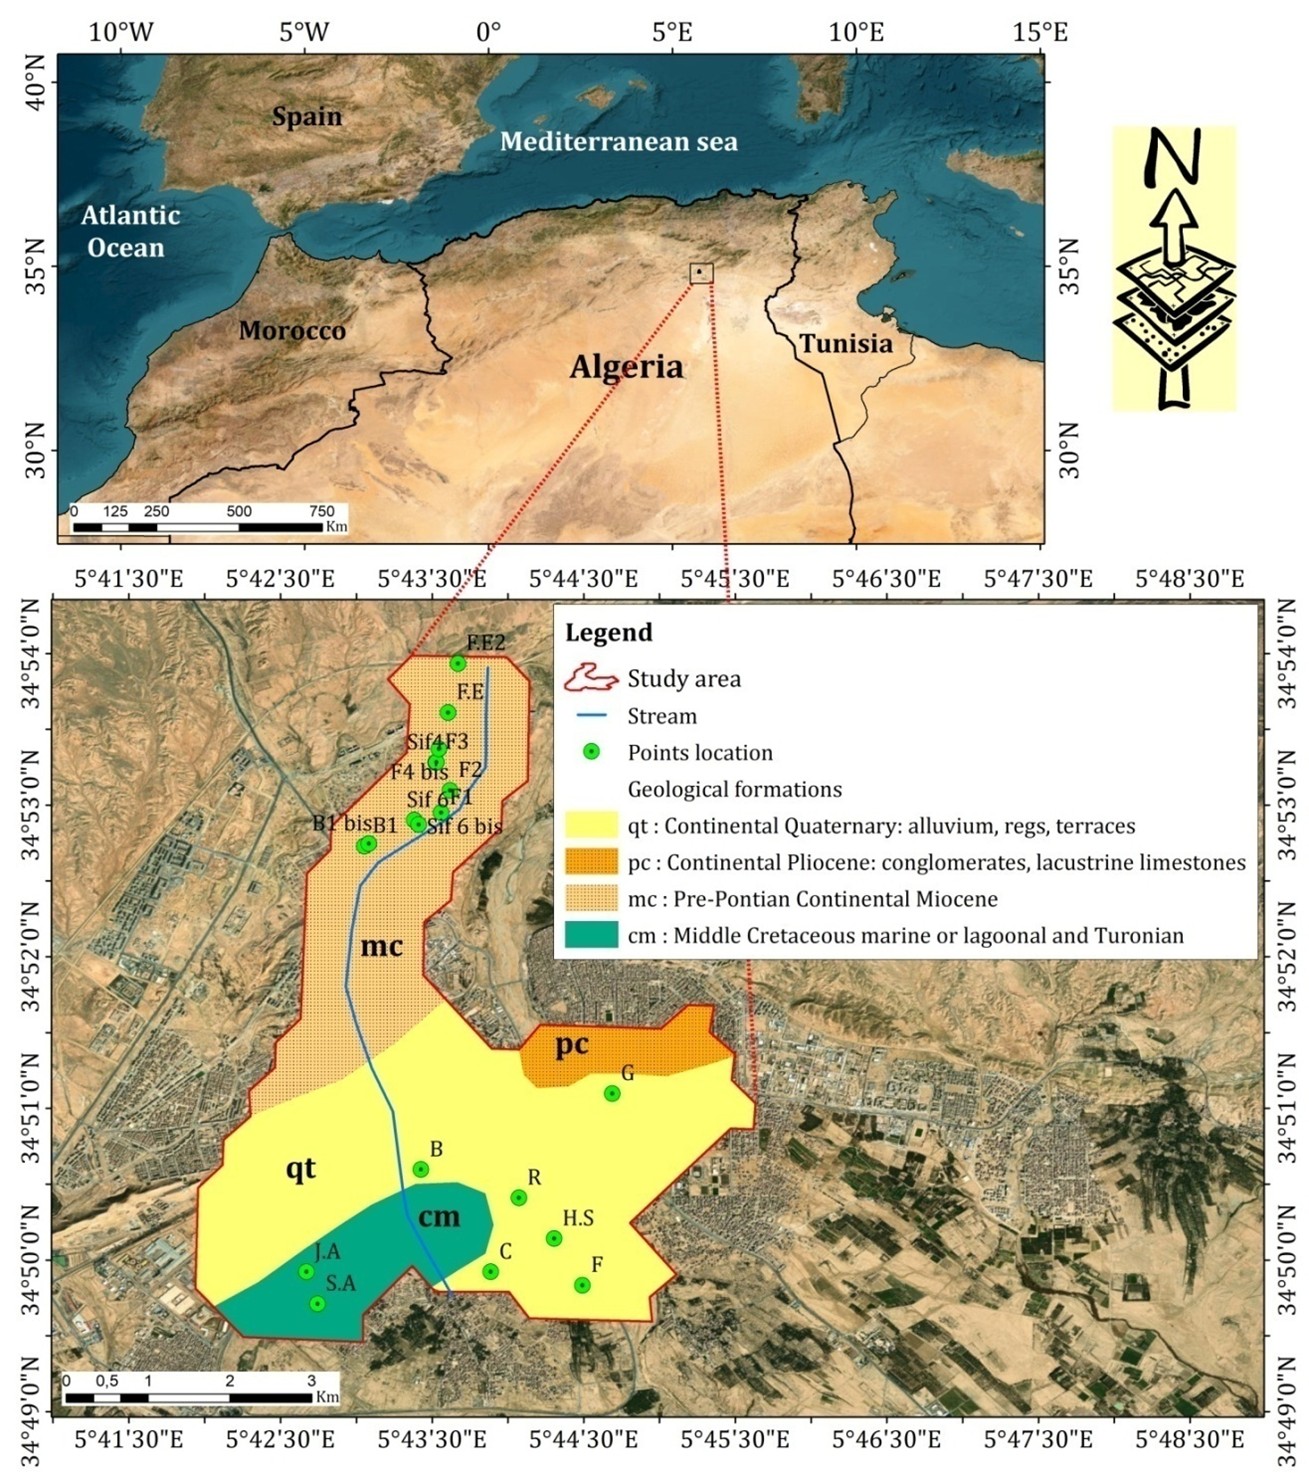
Located in eastern Algeria, south of the Aurès mountain range at 34° 51′ 50″ North and 5° 44′ 50″ East, the Biskra province (wilaya) comprises 30 municipalities. The Biskra municipality, chosen as the study area, covers an area of 40 km². It is bordered by Branis to the north, El Outaya to the northwest, Chetma to the east, Sidi Okba to the southeast, Oumache to the southwest, and El Hadjeb to the west (Figure 1).
The alluvial aquifer of the Wadi Biskra stretches along a north-south axis. It was formed by the erosion caused by Wadi Biskra through impermeable marls dating from the Miocene, which were subsequently filled with permeable alluvial deposits. The aquifer's substratum consists of a thick clay formation (Chebbah, 2007; ANRH, 2008; Later & Labadi, 2024). This aquifer is primarily recharged by precipitation, infiltration from neighboring wadis, and irrigation return flow.
A study of the climate over four decades (1980-2020) in the Biskra region reveals a hyper-arid regime. The main annual meteorological characteristics include: a wide temperature range (7-40°C), low precipitation (110.55 mm), a moderate relative humidity of 52%, and very high potential evaporation, estimated at 2602 mm/year.
The depth to the water table varies considerably, from 20 to 150 meters, with flow rates ranging from 5 to 20 liters per second. In the capture zone of Wadi Biskra, the piezometric surface is on average at a depth of 3 meters, but it drops further during dry periods (ANRH, 2008) due to annual withdrawals of 1108,351 m³ (2016) and high evapotranspiration. The drilling of over 100 boreholes between 1980 and 2000, coupled with the construction of the Fontaine of Gazelles dam, has led to a continuous decrease in flow rates and groundwater levels. This overexploitation has progressively degraded the chemical quality of the water (Masmoudi, 2024).
2.2. Analytical Methods
A total of 19 wells (Figure 1) exploiting the phreatic aquifer of Oued Biskra were studied. Their flow rates range from 15 to 30 liters per second, and in some cases, can reach up to 50 liters per second. This aquifer is heavily exploited in the city of Biskra and the Feliache area, where it constitutes the sole source of drinking water and is used only marginally for irrigation purposes. The sampling campaign was conducted in April 2019. Nineteen boreholes used for drinking water supply, located within the internal catchment area of Oued Biskra (Figure 1), were selected as sampling points. Plastic bottles were used for sample collection. These bottles were first rinsed several times with tap water and then left to dry. Prior to filling, to avoid contamination, all bottles were washed three times with the water sample before use.
The bottles were filled to over flow to prevent any air-water interaction. Each bottle was labeled with a tag indicating the sample number, location, and sampling date. The analyses focused on major elements, including cations (Ca²+, Mg²+, Na+, and K+) and anions (Cl-, HCO3-, SO4²-), as well as on measurements of electrical conductivity, salinity, pH, and temperature. These analyses were carried out at the Scientific and Technical Research Center for Arid Regions in Biskra (CRSTRA) and at the Algerian Water Company in Biskra.
The quality of groundwater from the alluvial aquifer of Oued Biskra was studied using both univariate and multivariate statistical analyses, particularly Principal Component Analysis (PCA) (Halimi, 2024; Ahmed, 2022). In light of these threats, monitoring and evaluating groundwater quality have become imperative for planning and integrated resource management. Several approaches have been developed for this purpose, particularly the use of synthetic indices that convert complex physico-chemical data into understandable and actionable information. Among these:
• The Gibbs diagram, combined with other graphical tools (Piper and Schoeller diagrams, 1965), provides powerful diagnostic insight into aquifer geochemical dynamics (Singh et al., 2019);
• The Water Quality Index (WQI), initially proposedbyHorton (1965) and refined by Brown et al. (1972);
•The Groundwater Pollution Index (GPI), developed by Subba Rao (2012);
• The Sulfate Percentage Index (SPI) (Subba Rao, 2012; Sharma et al., 2020).
2.2.1. Gibbs Diagram
The Gibbs diagram is a commonly used graphical tool to assess the relationship between groundwater chemistry and aquifer lithology (Edukondal et al., 2020). It enables the classification of groundwater into three distinct hydrogeochemical regimes: precipitation dominance, evaporation dominance, and rock–water interaction dominance (Gibbs, 1970). The Gibbs ratios are calculated using the following equations:

2.2.2. Water Quality Index (WQI)
The Water Quality Index is a widely recognized method for assessing groundwater quality and determining its suitability for domestic purposes. It is calculated using the weighted arithmetic method originally proposed by Horton(1965) and used by Hamlat & Guidoum (2018); Talhaoui et al. (2020); Ram et al. (2021); Akhtar, N. et al. (2021). The WQI is defined as follows:

Qn: Quality rating (sub-index) of the n‑th water quality parameter,
Wn: Unit weight assigned to the n‑th water quality parameter,
The unit weight (Wn) of each parameter is calculated using the following formula:

Where:
Sn: Standard permissible value of the n‑th water quality parameter
K: Proportionality constant, calculated using the following expression:

According to Brown et al. (1972), the quality rating or sub-index (Qn) is calculated using the equation below:

Where:
Vn: Measured concentration of the n‑th parameter;
Sn: Standard permissible value of the n‑th parameter;
V0: Ideal value for the n‑th parameter in pure water.
All ideal values (V0) are assumed to be zero for drinking water, except for pH and dissolved oxygen (Tripathy & Sahu, 2005). For pH, the ideal value is 7.0 (representing pure water), while the permissible limit is 8.5 in the case of polluted water. Similarly, for dissolved oxygen, the ideal value is 14.6 mg/L, whereas the acceptable standard for drinking water is 5mg/L. These values were taken into consideration during the calculation. The resulting Water Quality Index (WQI) values were then classified into five categories, as presented in Table 1.
|
Table 1. Classification of water quality based on Water Quality Index (WQI) values (Sahu and Sikdar, 2008; Hamlat and Guidoum, 2018;Tiwari et al., 2018). |
|||
|
Classes |
WQI Value |
Water Quality |
Interpretation |
|
I |
0 – 50 |
Excellent |
Perfectly potable water, without any restrictions |
|
II |
50 – 100 |
Good |
Drinkable water with minimal treatment |
|
III |
100 – 200 |
Fair to poor |
Treatment required before consumption |
|
IV |
200 – 300 |
Poor |
Unsuitable without intensive treatment |
|
V |
> 300 |
Unfit for consumption |
Heavily polluted water, not potable |
2.2.3. The Groundwater Pollution Index (GPI)
Developed by Subba Rao (2012), this methodology is used to assess groundwater quality by evaluating the influence of specific parameters on overall water quality. It provides a framework for identifying potential contamination sources and understanding the spatial distribution of groundwater pollution (Subba Rao et al., 2020).
The calculation of the Groundwater Pollution Index involves five steps:
1: Assignment of Relative Weight (RW);
2: Calculation of Weighted Parameter (WP):

3: Calculation of the Concentration (SC);
4: Calculation of the Groundwater Pollution Index (GPI);
5: Interpretation of Groundwater Pollution Index (GPI) values.
According to Subba Rao (2012), the GPI-based classification of water quality consists of five categories (Table 2).
|
Table 2. Classification of the Groundwater Pollution Index (GPI) according to Subba Rao (2012). |
|
|
GPI Value |
Pollution level |
|
< 1 |
Unpolluted |
|
1 – 1.5 |
Slightly polluted |
|
1.5 – 2 |
Moderate pollution |
|
2 – 2,5 |
High pollution |
|
> 2.5 |
Very high pollution |
2.2.4. The Sulfate Pollution Index (SPI)
The Sulfate Pollution Index is commonly used to assess sulfate contamination in water. It is calculated by comparing the measured sulfate concentration in a water sample to a reference or standard value, according to the following formula:

Where:
Csulfates: is the sulfate concentration in the water sample (mg/L),
Creference: is the acceptable threshold concentration for drinking water (e.g., 250 mg/L according to WHO standards 2004).
If: SPI < 1: Low or acceptable level of pollution,
SPI ≥ 1: Significant sulfate pollution.
3. RESULTS AND DISCUSSION
3.1. Statistical Data Processing
Statistical analysis was carried out on the 19 groundwater samples. These samples were analyzed for major ions (Ca, Mg, Na, K, Cl, SO4, HCO3, RS, NO3, EC, pH, and T). The statistical parameters of these variables were calculated and are presented in Table 3.
|
Table 3. Basic statistics of the average concentrations of physicochemical parameters in groundwater. |
|||||
|
El |
N |
Mean |
Min |
Max |
St D |
|
Ca |
19 |
343.78 |
200 |
412.00 |
67.04 |
|
Mg |
19 |
162.20 |
80 |
206.40 |
37.06 |
|
Cl |
19 |
326.57 |
163 |
568.00 |
133.50 |
|
SO4 |
19 |
1050.52 |
756 |
1664.00 |
265.08 |
|
HCO3 |
19 |
315.35 |
201 |
1073.00 |
238.80 |
|
NO3 |
19119 |
19.84 |
11 |
44.00 |
8.74 |
|
RS |
19 |
2312.10 |
1600 |
3480.00 |
472.12 |
|
CE |
19 |
3112.36 |
1644 |
5090.00 |
985.98 |
|
K |
19 |
12.310 |
9.99 |
14.08 |
1.24 |
|
Na |
19 |
562.90 |
188 |
754.00 |
189.68 |
|
pH |
19 |
7.36 |
7.12 |
7.66 |
0.19 |
|
T° |
19 |
23.51 |
18.60 |
28.50 |
2.31 |
|
El: elements, N: number of wells, Mean: average concentration in the wells, Min: minimum concentration, Max: maximum concentration, St D: standard deviation of well values. |
|||||
The groundwater in the studied area shows a neutral pH (ranging from 7.12 to 7.66), influenced by the geological facies and the dissolved CO2. Electrical conductivity exhibits anomalously high values, ranging from 1644 to 5090 μS/cm, indicating mineralization and intense evaporation. Sodium (Na+) is the dominant cation, followed by calcium (Ca²+), magnesium (Mg²+), and potassium (K+), the latter being present in low concentrations. These elements may originate from the decomposition of minerals, rock weathering, and agricultural fertilizers. Sulfates (SO4²-), chlorides (Cl-), and bicarbonates (HCO3-) also show elevated concentrations. Nitrates (NO3-) reflect the influence of the hydrogeochemical background and/or anthropogenic inputs.
The correlation matrix of all 19 data points was calculated (Table 4), along with the factor loadings (Table 5). Correlation circles were also plotted (Figure 2).
|
Table 4. Simple linear correlation matrix calculated for the entire dataset. |
||||||||||||
|
|
Ca |
Mg |
Cl |
SO4 |
HCO3 |
NO3 |
RS |
CE |
K |
Na |
PH |
T° |
|
Ca |
1,00 |
|
|
|
|
|
|
|
|
|
|
|
|
Mg |
0,47* |
1,00 |
|
|
|
|
|
|
|
|
|
|
|
Cl |
-0,53* |
0,05 |
1,00 |
|
|
|
|
|
|
|
|
|
|
SO4 |
-0,19 |
-0,14 |
0,22 |
1,00 |
|
|
|
|
|
|
|
|
|
HCO3 |
0,25 |
0,21 |
-0,36 |
-0,28 |
1,00 |
|
|
|
|
|
|
|
|
NO3 |
-0,34 |
-0,21 |
0,30 |
0,61* |
-0,13 |
1,00 |
|
|
|
|
|
|
|
RS |
-0,50* |
0,07 |
0,81* |
0,35 |
-0,23 |
0,46* |
1,00 |
|
|
|
|
|
|
EC |
-0,81* |
-0,34 |
0,71* |
0,20 |
-0,09 |
0,46* |
0,69* |
1,00 |
|
|
|
|
|
K |
0,56* |
0,28 |
-0,38 |
0,26 |
0,21 |
0,15 |
-0,14 |
-0,50* |
1,00 |
|
|
|
|
Na |
0,59* |
0,31 |
-0,36 |
0,28 |
0,10 |
0,15 |
-0,09 |
-0,48* |
0,95* |
1,00 |
|
|
|
PH |
-0,30 |
-0,35 |
-0,04 |
-0,32 |
-0,41 |
-0,26 |
-0,21 |
-0,11 |
-0,35 |
-0,39 |
1,00 |
|
|
T° |
0,14 |
0,41 |
-0,26 |
0,37 |
0,23 |
0,42 |
-0,10 |
-0,11 |
0,23 |
0,24 |
-0,27 |
1,00 |
|
*: Significant correlation. |
||||||||||||
|
Table 5. Results of the Principal Component Analysis (PCA) performed on the full dataset from the borehole samples. |
|||
|
Fact. 1 |
Fact. 2 |
Fact. 3 |
|
|
Eigen value |
4,10 |
2,313 |
1,293 |
|
Variance (%) |
41,02 |
23,139 |
12,935 |
|
Cum variance (%) |
41,02 |
64,165 |
77,100 |
|
Ca |
-0,877 |
-0,111 |
-0,175 |
|
Mg |
-0,391 |
-0,165 |
-0,823 |
|
Cl |
0,796 |
-0,168 |
-0,468 |
|
SO4 |
0,281 |
-0,753 |
0,297 |
|
HCO3 |
-0,378 |
0,140 |
-0,174 |
|
NO3 |
0,451 |
-0,674 |
0,248 |
|
RS |
0,716 |
-0,436 |
-0,426 |
|
CE |
0,907 |
-0,045 |
-0,058 |
|
K |
-0,637 |
-0,697 |
0,019 |
|
Na |
-0,618 |
-0,726 |
-0,008 |
The correlation matrix shows a significant positive correlation between pairs such as Na/K (0.95), Cl/RS (0.81), and EC/Cl (0.71). Significant negative correlations were observed between EC/Ca (-0.81), Cl/Ca (-0.53) and RS/Ca (-0,50).
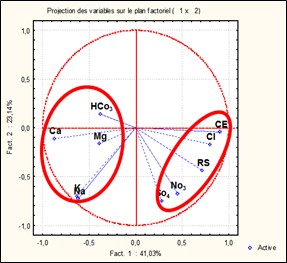
The graphical representation of the correlations between variables, on the one hand, and between loading factors, on the other, made it possible to visualize the degree of association between these elements, as well as the significance of their correlations with the various factors.
The correlation circles highlight two groups of associations (Figure 2). The first group includes SO4, Cl, EC, NO3, and RS, which are positively correlated with factor F1 and negatively with factor F2. This association suggests that electrical conductivity is mainly influenced by sulfate and chloride concentrations. From a geological perspective, it reflects the influence of Triassic facies. The second group consists of HCO3, Mg, Ca, K, and Na. It indicates water–rock interaction processes, where the enrichment in Mg²+ and Ca²+ may result from the dissolution of dolomite and limestone.
3.2. Hydrogeochemical characteristics
3.2.1. Piper and Schoeller-Berkaloff diagrams
The waters of this aquifer (Figures 3A and3B) are characterized by a sodium–potassium chloride facies, evolving towards a calcium–magnesium sulfate facies, particularly at the borehole locations. The dominant ions are chlorides and sulfates among the anions, and sodium and potassium among the cations. A progressive increase in total dissolved solids has been observed in the groundwater of the Oued Biskra aquifer. The ionic distribution clearly highlights a marked predominance of chlorides and sulfates over calcium and magnesium.
3.2.2. Gibbs diagram
The majority of the samples are located in the evaporation-dominant domain (Figure 3C), indicating that significant evaporative processes influence the concentration of dissolved salts, particularly in arid or semi-arid regions such as the Biskra area. No samples fall within the precipitation-dominant domain, suggesting a limited recharge of the aquifer by flood events (Later & Labadi, 2024). These findings confirm that evaporation is the main factor controlling the chemical quality of groundwater in this region.

3.2.3. Water Quality Index (WQI)
The results of the groundwater quality index for drinking purposes are presented (Figure 4A). Water Quality Index (WQI) values range from 103.76 to 178.39, with an average of 137.26. According to the WQI classification (Table 1), these values fall into Class III, indicating that the groundwater quality ranges from moderate to poor. The results show that most of the borehole water from the Oued Biskra well field requires treatment before being suitable for human consumption.
3.2.4. Groundwater Pollution Index (GPI)
The relative weight (RW) was first assigned, and then the weighted parameter (WP) for each individual parameter was calculated (Table 6). These results were then used to compute the GPI index (Figure 4B).

|
Table 6. Analyzed parameters with their respective values of RW, WP, and WHO standards (2011). |
|||
|
Parameters |
RW |
WP |
OMS (mg/l) |
|
Cond |
4 |
0,105 |
1000 |
|
pH |
4 |
0,105 |
7,5 |
|
Ca |
2 |
0,053 |
75 |
|
Mg |
2 |
0,053 |
50 |
|
Na |
4 |
0,105 |
200 |
|
Cl |
5 |
0,131 |
250 |
|
HCO3 |
3 |
0,079 |
500 |
|
SO4 |
5 |
0,132 |
250 |
|
NO3 |
5 |
0,132 |
50 |
|
R.S (mg/l) |
4 |
0,105 |
500 |
|
Somme |
38 |
1 |
|
Overall, the Groundwater Pollution Index (GPI) indicates that the borehole samples from the study area are not suitable for human consumption. The spatial distribution of the GPI (Figure 4B) shows that most of the water samples exhibit contamination levels ranging from moderately polluted to highly polluted, suggesting that the water in this region. Cannot be directly recommended for domestic use.
3.2.5. Sulfate Pollution Index (SPI)
According to the results obtained, the SPI index ranges from 3 to 6.65 (Figure 4C), which largely exceeds the acceptable limit. This indicates that the water is highly polluted by sulfates, making it unfit for consumption. This pollution is partly linked to the presence of gypsum in the soil of the Oued Biskra, a mineral that dissolves more easily in water than limestone. The use of sulfur-based fertilizers, pesticides, and agricultural amendments containing sulfates may also contribute to the contamination of groundwater through infiltration into the soil (Sutton et al., 2013).
4. DISCUSSIONS
A comparison of the maps for the Water Quality Index (WQI), the Groundwater Pollution Index (GPI), and the Sulfate Pollution Index (SPI) reveals two areas of very high pollution in the north and south (Figure 4), as well as a central area with moderate pollution. To identify the origin of this contamination, we overlaid these maps with the map of pollution sources (Figure 5), which inventories wastewater discharges in the region. This cross-analysis shows that the number of industrial enterprises located outside the perimeter of the Biskra aquifer is relatively low. In contrast, those located within the aquifer's boundaries – such as the Chaabet Roba discharge and the Z’mor Wadi constitute a significant threat to the water resource.

5. CONCLUSIONS
This study focuses on the alluvial aquifer of Oued Biskra, a strategic water resource that has been exploited since the 1950s for drinking water supply and agricultural irrigation. Composed primarily of pebbles, gravel, and sand, this aquifer holds major hydrogeological significance for the region.
Interpretation of the Piper and Schoeller diagrams indicates that the groundwater in the area is predominantly of the sodium-chloride and potassium-chloride type, with a tendency in some boreholes toward the calcium-magnesium sulfate pole. The dominant ions are chlorides and sulfates among the anions, and sodium and potassium among the cations. A progressive increase in total dissolved solids is observed, with a clear predominance of chlorides and sulfates over calcium and magnesium.
According to the Gibbs diagram, groundwater samples from the Oued Biskra well field fall within the domain governed by evaporation processes and water–rock interactions.
Analysis of groundwater quality indices—namely the Water Quality Index (WQI), the Groundwater Pollution Index (GPI), and the Sulfate Pollution Index (SPI)—reveals significant pollution, largely attributable to domestic and industrial discharges.
These findings highlight the urgent need for advanced water treatment, particularly to reduce the concentration of dissolved salts (mineralization), before the water can be recommended for domestic.
REFERENCES
- Ahmed, M., Ahmed, A., Fahad, A., Ahmed, A., Abdullah, O. 2022. Hydro-Geochemical Applications and Multivariate Analysis to Assess the Water–Rock Interaction in Arid Environments. Appl. Sci. 12, 6340. https://doi.org/10.3390/app12136340.
- Akhtar, N., Syakir, I. M. I., Mardiana, I. A., Khalid, U., Mohamad, Sh. Md. Y., Mohd, T. A., Abdul, Q., Yazan, Kh. A. A., 2021. Modification of the Water Quality Index (WQI) Process for Simple Calculation Using the Multi-Criteria Decision-Making(MCDM) Method. Water 13, 905.
- Ammar, R., El Samrani, A. G., Kazpard, V., Bassil, J., Lartiges, B., Saad, Z., & Chou, L., 2013. Applying physicochemical approaches to control phosphogypsum heavy metal releases in aquatic environment,Environmental Science and Pollution Research, 20(12), 9014-9025. https://doi.org/10.1007/s11356-013-1875-7.
- ANRH 2008. Inventory of Water Points and Survey of Extraction Rates in the Biskra Province, Report.National Water Resources Agency. Report.
- Attoui, B., Sayad, L., Majour, H., Boudjebieur, E., Boulahia, A., & Lamrous, W. 2024. Impact of Technical Landfill Bouguerguer on Water Resources and the Environment North-East Algeria.Carpathian Journal of Earth and Environmental Sciences, 19(1), 157-168. https://doi.org/10.26471/cjees/2024/019/287.
- Bouchemal, F., Bouchahm, N., Achour, S., 2015. Qualité des eaux des nappes aquifères de la région de Biskra, Rev. sci. fond. app. vol. 3 N°. 1.
- Bouchemal, F., Achour, S., 2022. Assessment of physicochemical parameters and suitability for irrigation of groundwater resources from biskra area (Southeastern Algeria), International Journal of Engineering Research in Africa, ISSN: 1663-4144, Vol. 58, pp 127-137.
- Brown, R. M., Mc Clelland, N. I., Deininger, R. A., & Tozer, R. G. 1972. A Water Quality Index — Crashing the Psychological Barrier,W. A. Thomas (ed.), Indicators of Environmental Quality.
- Chebbah, M., 2007. Lithostratigraphie, Sédimentologie et modèles de Bassins des dépôts néogènes de la région de Biskra, de part et d’autre de l’accident Sud Atlasique (Ziban, Algérie). Thèse de doctorat d’état de l’université de Constantine. 450 p.
- Edukondal, A., Hari, G. K., Ramalingaiah, A., & Muralidhar, M., 2020. Groundwater quality with special reference to fluoride concentration in the granitic and basaltic contact zone of southern India, Data in Brief Volume 33, https://doi.org/10.1016/j.dib.2020.106462.
- Fehdi, Ch., Rouabhia, Aek., Baali, F., Boudoukha, A., 2009. The Hydrogeochemical Characterization of Morsott-El Aouinet, Environ Geol . 58,1611–1620.
- Gibbs, R. J., 1970. Mechanisms controlling world water chemistry, Science, 170(3962), 1088-1090. https://doi.org/10.1126/science.170.3962.1088.
- Guergazi, S., & Achour, S.2005.Physico-chemical characteristics of drinking water in Biskracity, Larhyss Journal, 4, 119-127.
- Halimi, F., & Djabri, L. 2024. Contribution of Geostatistical Methods to Water Quality Assessment: a Case Study of the Tebessa Plain (Easternmost Algeria), Doklady Earth Sciences, 507(Suppl 2), S287-S298. https://doi.org/10.1134/S1028334X23602985.
- Hamlat, A., Guidoum, A., 2018. Assessment of groundwater quality in a semiarid region of Northwestern Algeria using water quality index (WQI). Applied Water Science, 8, 163,https://doi.org/10.1007/s13201-018-0863-y.
- Horton, R. K.,1965. An index number system for rating water quality, Journal of the Water Pollution Control Federation, 37(3), 300-306.
- Later, F., & Labadi, A. S., 2024. Origin of the alluvial aquifer's groundwater in Wadi Biskra (Algeria), Larhyss Journal, 57, 145-158.
- Masmoudi, T.,Benakchaa, M., Abdennourb, M. A., Bouzekrid, A., Amranee, A., Francisco, J., & Alcalaf, G., 2024. Groundwater quality evaluation for drinking and agricultural purposes. A case study in semi-arid region (Zab El-gharbi SE-Algeria), Desalination and Water Treatment, https://doi.org/10.1016/j.dwt.2024.100476.
- Ram, A., Tiwari, S. K., Pandey, H. K., Chaurasia, A. K., Singh, S., & Singh, Y. V., 2021. Groundwater quality assessment using water quality index (WQI) under GIS framework. Applied Water Science, 11, Article 94, https://doi.org/10.1007/s13201-021-01376-7.
- Remini, B., Kechad, &., R Achour, B., 2014.The collecting of groundwater by the qanats: a millennium technique decaying, Larhyss Journal, ISSN 1112-3680 7-17.
- Sahu, P. Sikdar, P.K., 2008. Hydrochemical Framework of the Aquifer in and around East Kolkata Wetlands, West Bengal, India. Environmental Geology, 55, 823-835, https://doi.org/10.1007/s00254-007-1034-x.
- Schoeller H., 1965. Qualitative Evaluation of Groundwater Resources. In Methods and Techniques of Groundwater Investigation and Development. Water Research Series, UNESCO: Paris, France, pp. 54–83.
- Sedrati, N., 2008. Origines et caracteristiques physico-chimiquesdes eaux de la wilaya de Biskra-Sud Est Algerien, 252p.
- SedratiN., 2011. Origines et caracteristiques physicochimiques des eaux de la wilaya de Biskra-sud est Algérien. Thèse Doctorat de l’Université Badji Mokhtar-Annaba, Algérie, 252p.
- Sedrati, N., & Majour, H., 2020. Groundwater Protection using Wyssling Method for Perimeter Protection : A Case Study in the Biskra Aquifer (South East of Algeria), water and energy , international, vol. 63/RNI, no. 5, ISSN: 0974-4711Rs. 200/-
- Sharma, A., Ganguly, R., & Kumar, A. 2020. Impact assessment of leachate pollution potential on groundwater: an indexing method.Journal of Environmental Engineering. Vl146n3.
- Singh, J., Yadav, P., Pal, A. K., & Mishra, V., 2019.Water Pollutants: Origin and Status, Sensors in Water Pollutants Monitoring: Role of Material, https://doi.org/10.1007/978-981-15-0671-0_2.
- Subba Rao, N., 2012. PIG: a numerical index for dissemination of groundwater contamination zones.Hydrological Processes, 26(22), 3344-3350, https://doi.org/10.1002/hyp.8456.
- Subba Rao, N., Sunitha, B., Rashmirekha Das., Anil Kumar, B., 2020. Monitoring the causes of pollution using groundwater quality and chemistry before and after the monsoon, Physics and Chemistry of the Earth, Parts A/B/C, Volume 128, https://doi.org/10.1016/j.pce.2022.103228.
- Sutton, M. A., Howard, C. M., Erisman, J. W., Billen, G., Bleeker, A., Grennfelt, P., van Grinsven, H., &Grizzetti, B. 2013. Towards a climate-dependent paradigm of ammonia emission and depositionSociety B: Biological Sciences, 368(1621), https://doi.org/10.1098/rstb.2013.0166.
- Talhaoui, A., El Hmaidi, A., Jaddi, H., &Ousmana. 2020. Calcul de l’indice de qualite de l’eau (iqe) pour l’evaluation de la qualite physico-chimique des eaux superficielles de l’oued moulouya (ne, maroc), European Scientific Journal,https://doi.org/10.19044/esj.v16n2p64.
- Tiwari, A. K., Singh, A.K., Mahato, M. K., 2018. Assessment of groundwater quality of Pratapgarh district in India for suitability of drinking purpose using water quality index (WQI) and GIS technique, Sustainable Water Resources, Volume 4, pages 601–616.
- Tripathy, J. K., &Sahu, K. C. 2005. Seasonal hydrochemistry of groundwater in the barrier spit system of the Chilika lagoon, India. Journal of Environmental Hydrology, 13(26), 1-8.
- WHO, 2004. International standards for drinking-water, 3rd edition.