1. INTRODUCTION
Air contamination is a serious environmental issue that has a major influence on population, ecosystems, and climate. Rapid economic development and urban growth have a considerable negative impact on air quality in Vietnam. The World Health Organization reported that there were approximately 60 thousand deaths in Vietnam in 2016 related to air pollution (WHO 2018).
It also affects the economy of the country, leading to an economic loss of 10.82–16.63 billion US dollars, which is the equivalence of around 5% GDP nationwide (Nguyen et al., 2022). Therefore, it is critically important to develop uniform national air quality monitoring system in Vietnam, which at this stage does not exist (Hung et al., 2020).
Currently, national and international organizations perform monitoring of air quality using monitoring stations and automatic devices. However, often this monitoring systems have low accuracy, offer data only for a limited number of contaminants, and demand lot of money and labor for restricted ground coverage (Giordano et al., 2021; Singh et al., 2021). The shortcomings of the traditional techniques can be overcome by biological monitors such as plants, lichens or mosses (Giordano et al., 2021; Thakur et al., 2024; Vergel et al., 2024). Mosses are effective bioindicators of air pollution that can be applied to depict the overall level of contamination. Wide application of mosses as biomonitors is explained by their structure, large surface area, tolerance to contaminants, rapid growth and ubiquitous presence (Zinicovscaia et al., 2022; Baczewska-Dabrowska et al., 2023).
In 1997, a research team from the Institute of Physics (Vietnam Academy of Science and Technology) carried out the first moss biomonitoring study in Vietnam as part of the International Cooperative Program on Effects of Air Pollution on Natural Vegetation and Crops (ICP Vegetation). Since 2017, some Vietnamese cities, such as Ha Noi, Hai Phong, and Da Lat, as well as other areas in central Vietnam, have implemented the moss biomonitoring technique (Doan Phan et al., 2019; Khiem et al., 2020a, b; Quyet et al., 2021; Son et al. 2021; Tien et al., 2022; Khiem et al., 2022; Nguyen et al., 2023). All these studies showed significant influence of the industrial activity on the air quality. Thus, Hanoi showed to be highly polluted with Co, V and Se and moderately contaminated with Cl, Cr, As, Br, Zr, Nb, Mo and Hg due to traffic and industrial activity (Khiem et al., 2020b). Road dust, diesel fuel combustion, and industrial operations are the primary sources of Cl, Se, Sm, Cd, Al, Co, Ce, Eu, Hf, Nd, K, Ta, Sc, Th, Ti, and V emissions in Hai Phong (Khiem et al., 2022). In Red River Delta and South-Central Vietnam air pollution is linked to transport, industry and agricultural activity (Tien et al., 2022).
Thus, in 2023 moss biomonitoring was conducted to evaluate the level of air pollution in Bac Ninh and Hung Yen, two sizable industrial cities in northern Vietnam. Inductively coupled plasma optical emission spectroscopy (ICP-OES) and a direct mercury analyzer were applied for Barbula indica moss samples elemental analysis. Statistical tools (factor and correlation analyses) and ecological indices (contamination factor) were applied to process obtained biomonitoring data.
The outcomes of this study will help to the understand the dynamics of pollution in Vietnam and create a focused air quality management strategy. Additionally, the results will serve as a baseline for next monitoring programs, aiding in the endeavor to lessen the detrimental impacts of air pollution.
2. MATERIALS AND METHODS
2.1. Studied area
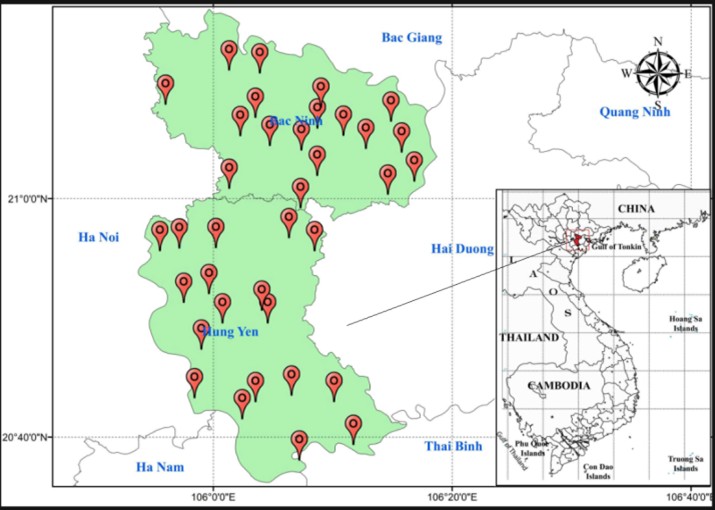
Moss biomonitoring was performed in Bac Ninh and Hung Yen provinces (Figure 1), both located near the capital Hanoi. They are characterized by very high population density and are the provinces with the most developed industrial production in the country. Bac Ninh and Hung Yen provinces are both located in the Red River Delta, in the northern region of Vietnam. The region is underlain by 20–40 meters of Quaternary sediments, consisting of alternating clay, silt, sandy silt, fine to medium sand, and peat layers, over Neogene and older metamorphic rocks (Hoang et al., 2019). Natural resources include groundwater, clay, construction sand, and limited peat. Notably, mosses in these environments absorb only about 5–10% of nutrients from soil via rhizoids, relying mainly on rain, dew, and atmospheric deposition for nutrition (Turetsky, 2003).
Bac Ninh province with administrative center Bac Ninh city and population density of 1,718 people/km² is located in the Northern Key Economic Region. Numerous hundreds-year-old traditional craft villages in the province produce sophisticated and unique handicraft products. There are currently 62 craft villages in Bac Ninh, primarily focused on fine art woodwork, paper production, pottery, iron, recycled steel, and bronze casting. In addition to craft communities, Bac Ninh currently has a large number of industrial parks (Anonymous 2024a, b).
Hung Yen, a province with population density of 1,400 people/km2 is located in the center of the Red River Delta, Vietnam. In 2022, in Hung Yen functioned 59 craft villages and 17 industrial parks, scattered in communes and districts. The products produced in the province are very diverse: textiles, leather shoes, automobiles, motorbikes, electronics, civil electricity, food industry, precision mechanics, and construction steel (Anonymous 2024c, d). The results of the environmental quality investigation in the craft villages in Red River Delta including Bac Ninh and Hung Yen have shown that dust concentrations many times exceed the permissible limits and large volumes of industrial solid waste are generated (Nguyen 2020).
2.2. Moss sampling
Barbula indica is the most dominant moss species in Vietnam (Khiem et al., 2020a). Mosses was collected in April 2023 at 36 sampling locations (18 sites in Hung Yen and 18 in Bac Ninh) across provinces (Figure 1). The ICP Vegetation program's guidelines was followed when collecting moss samples (Frontasyeva et al., 2020). The instruction stated, that from 1000 km2 1.5 L of mosses should be collected at a distance of 300 m and 100 away from main and small roads, respectively. In laboratory, collected mosses were cleaned of extraneous contaminants and green and green-brown moss segments were used for elemental analysis.
2.3. Laboratory Analysis
All reagents used in this study were of analytical grade obtained from Merck company (Darstadt, Germany). 0.2 g of samples, placed in a Teflon vessel were treated with 2 mL of concentrated HNO3 and 1 mL of H2O2. Samples digestion was conducted in the Mars 6 microwave digestion system (CEM, USA). Obtained samples were analyzed on the ICP-OES PlasmaQuant 9000 Elite (Analytik Jena, Germany) spectrometer to determine the content of Al, V, Cr, Mn, Fe, Co, Ni, Cu, Zn, Cd, and Pb. Mercury content in samples was determined using a direct mercury analyzer Milestone DMA-80evo (Milestone Srl, Italy). Except drying and homogenization, no additional sample preparation is required for this method.
To check the accuracy of measurements the NIST SRM 1547 (Peach leaves), and M2 (moss Pleurozium schreberi with different element content, Finnish Forest Research Institute, Finland) were used. All measurements were performed in triplicate. The recovery of the elements was on the level of 78- 107% and can be considered satisfactory (Aničić Urošević et al. 2024) (Table 1).
|
Table 1. The results of the quality control of the analytical measurements and detection limits of the techniques. |
|||||||
|
1547 |
M2 |
|
|||||
|
Element |
Determined content, mg/kg |
Certified value, mg/kg |
Recovery, % |
Determined content, mg/kg |
Certified value, mg/kg |
Recovery, % |
Detection limit |
|
Al |
223 |
249 |
89 |
179 |
175 |
102 |
0.0029 |
|
Cu |
3.3 |
3.7 |
90 |
58 |
68 |
85 |
0.0002 |
|
Cd |
0.03 |
0.03 |
104 |
0.40 |
0.45 |
87 |
0.0001 |
|
Co |
0.07 |
0.07 |
100 |
0.8 |
0.9 |
83 |
0.0002 |
|
Pb |
0.93 |
0.87 |
107 |
6.07 |
5.86 |
103 |
0.0004 |
|
Zn |
18.1 |
17.9 |
101 |
32.2 |
35.2 |
91 |
0.0002 |
|
V |
0.33 |
0.37 |
89 |
1.24 |
1.21 |
102 |
0.0045 |
|
Cr |
0.87 |
1.00 |
87 |
0.77 |
0.92 |
83 |
0.0008 |
|
Fe |
183 |
218 |
84 |
219 |
245 |
89 |
0.004 |
|
Mn |
92 |
98 |
93 |
281 |
357 |
78 |
0.0003 |
|
Ni |
0.39 |
0.69 |
86 |
13.6 |
14.8 |
92 |
0.0014 |
|
Hg |
0.03 |
0.03 |
100 |
n.d. |
n.d. |
- |
0.003 |
|
n.d.- not detected
|
|||||||
2.4. Statistical Analysis and Mapping
Descriptive statistical analysis was done using Microsoft Excel (Microsoft, Redmond, Washington, DC, USA) to obtain the main statistical characteristics including mean, median, standard deviation, coefficients of variation, skewness and kurtosis. The coefficient of variation (CV) was calculated as CV (%) = SD/Mean×100. Factor and correlation analyses were used to discover associations of elements and decrease the number of variables for the obtained results. The correlation analysis assesses the degree of the linear relationship between two variables (Janse et al., 2021). If two elements have good correlation it is considered that they originate from the same source (Lazo et al., 2024), while weak correlation indicates different sources of provenance. The factor analysis is intended to simplify the understanding of the obtained data set by reducing a large number of measurements to a small number of dimensions, or factors (Zeller 2004). Since obtained data were non-normally distributed the Box-Cox transformation was performed. For mapping the spatial distribution of the elements, the geographic information system Arc-GIS 10.8 (Esri, Redlands, CA, USA) was used.
2.5. Contamination factor
To assess the level of air the contamination factor (CF) can be used (Fernández & Carballeira 2001; Cesa et al., 2013). The factor is defined as follows:

where Ci and BGi are the average and background content of elements in moss samples in the study area, respectively. In the present study as the background content of a certain element was chosen the smallest concentration of the same element among the Barbula indica moss samples collected in neighboring areas including Hanoi, Hai Phong, Bac Ninh and Hung Yen provinces.
3. RESULTS AND DISCUSSION
3.1. Descriptive statistical analysis
The results of the descriptive statistical analysis for moss samples collected in two provinces are presented in Table 2.
Low values of CV indicate greater consistency and data precision, whereas high values point at greater dispersion and variability. The CVs for Al, Co, Cd, Fe, Hg, Mn, and V were all below 75%, suggesting that the mean values are statistically reliable. This implies the presence of a single statistical population, indicating a common source of potentially toxic elements (Vergel et al., 2024). In contrast, the CVs of Cr, Ni, Cu, Zn and Pb had very large values, namely 239, 138, 404, 124 and 206, respectively, indicating high asymmetry in data distribution (Lazo et al., 2022) or considerable impact of natural or anthropogenic sources of pollution (Nurkassimova et al., 2024). Furthermore, the high values of the skewness and kurtosis (Table 2) indicate that their distribution deviates greatly from the normal one.
|
Table 2. Descriptive statistics for moss samples collected in Bac Ninh and Hung Yen provinces, Vietnam (N = 36), in mg/kg. |
|||||||||
|
Element |
Mean |
Median |
SD |
CV, % |
Min |
Max |
Max/Min |
Kurtosis |
Skewness |
|
Al |
5042 |
4189 |
2707 |
54 |
1177 |
11700 |
9.9 |
-0.03 |
0.87 |
|
V |
12.0 |
10.7 |
5.8 |
48 |
2.7 |
293 |
11.0 |
1.7 |
1.10 |
|
Cr |
27 |
11.9 |
64 |
239 |
2.4 |
378 |
157 |
26 |
5.06 |
|
Mn |
222 |
181 |
163 |
73 |
57 |
922 |
16 |
9.3 |
2.70 |
|
Fe |
4899 |
4686 |
2004 |
40 |
1139 |
8969 |
7.8 |
-0.4 |
0.16 |
|
Co |
2.6 |
2.1 |
1.7 |
67 |
0.4 |
7.5 |
18 |
1.8 |
1.47 |
|
Ni |
11 |
7.1 |
14 |
138 |
2.1 |
82 |
39 |
16 |
3.87 |
|
Cu |
90 |
25 |
363. |
404 |
8.8 |
2208 |
248 |
36 |
5.98 |
|
Zn |
537 |
245 |
667 |
124 |
69 |
2468 |
35 |
2.2 |
1.86 |
|
Cd |
0.9 |
0.7 |
0.7 |
74 |
0.2 |
3.5 |
15 |
4.5 |
1.96 |
|
Hg |
0.17 |
0.15 |
0.09 |
50 |
0.04 |
0.41 |
9.5 |
1.32 |
1.04 |
|
Pb |
52 |
21 |
106 |
206 |
5.1 |
638 |
125 |
27 |
5.04 |
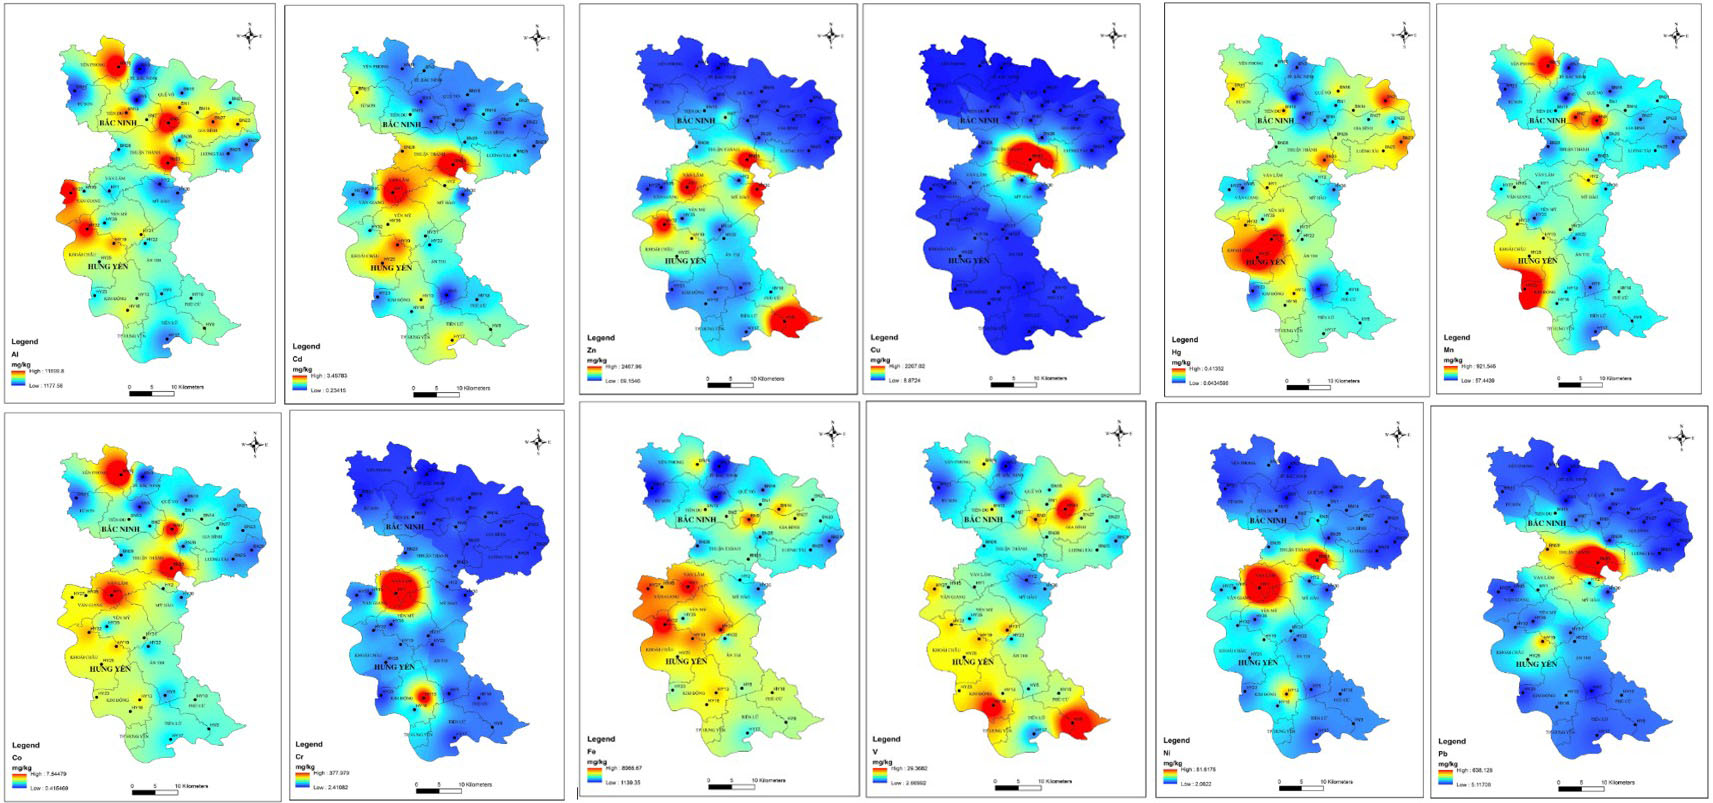
The spatial distributions of the content of PTEs determined in the moss samples collected in Bac Ninh and Hung Yen provinces are illustrated in Figure 2.
As it can be seen from the correlation matrix (Table 3) many elements are positively correlated with each other, which can indicate their common source of provinace (Gaza & Kugara 2018).
|
Table 3. Pearson correlation coefficient for elements determined in mosses collected in Bac Ninh and Hung Yen provinces, Vietnam (n = 36). |
||||||||||||
|
|
Al |
V |
Cr |
Mn |
Fe |
Co |
Ni |
Cu |
Zn |
Cd |
Hg |
Pb |
|
Al |
1 |
|
|
|
|
|
|
|
|
|
|
|
|
V |
.51 |
1 |
|
|
|
|
|
|
|
|
|
|
|
Cr |
-.06 |
.05 |
1 |
|
|
|
|
|
|
|
|
|
|
Mn |
.34 |
.29 |
-.02 |
1 |
|
|
|
|
|
|
|
|
|
Fe |
.67 |
.66 |
.40 |
.36 |
1 |
|
|
|
|
|
|
|
|
Co |
.72 |
.35 |
.38 |
.46 |
.67 |
1 |
|
|
|
|
|
|
|
Ni |
.19 |
.05 |
.84 |
.01 |
.42 |
.65 |
1 |
|
|
|
|
|
|
Cu |
.30 |
-.07 |
-.009 |
-.06 |
-.009 |
.48 |
.51 |
1 |
|
|
|
|
|
Zn |
.16 |
.21 |
.35 |
-.01 |
.28 |
.39 |
.55 |
.43 |
1 |
|
|
|
|
Cd |
.06 |
-.01 |
.49 |
-.13 |
.18 |
.48 |
.75 |
.64 |
.54 |
1 |
|
|
|
Hg |
.12 |
.17 |
.14 |
-.13 |
.19 |
.20 |
.24 |
.24 |
.24 |
.57 |
1 |
|
|
Pb |
.30 |
-.04 |
.05 |
-.07 |
.05 |
.50 |
.54 |
.95 |
.48 |
.76 |
.39 |
1 |
Moderate positive correlation was obtained between Al-V-Fe-C, V-Cu, Fe-Co-Ni-Cu-Zn-Pb, Cu-Cd-Cd-Hg. Strong positive correlation was obtained for Cr-Ni, Cu-Pb, Ni-Cd, Cd-Pb pairs. Important sources of Pb, Cd, Ni, Cu, Hg and Zn are vehicles and industry emissions, oil combustion, and resuspended road dust (Thomaidis et al., 2003). As important sources of Al, V, Fe Co, V and Cu can be considered industry and urban dust (Krupnova et al., 2020). By 2024, Bac Ninh boasts 15 major industrial parks, which focus on high-tech industries, component manufacturing, food processing, pharmaceuticals, supporting industries, new materials production (Anonymous 2024e). Industrial sector in Hung Yen province includes electrical and electronic industry, food processing, light industry, mechanics production, clothing industry, etc. (Anonymous 2024f).
By applying factor analysis four relevant factors were found to explain 82.93% of the total variation namely: F1 (Co, Cu, Cd, Pb), F2 (Al, V, Mn, Fe, Co), F3 (Cr, Ni, Cd) and F4 (Hg) (Table 4, factor scores are presented in Table (S1)). The values written in bold font in Table 4 indicate significant loadings (≥ 0.5) otherwise it may just be random fluctuations (Berg et al., 1995).
|
Table 4. Varimax rotated factor matrix for mosses collected in Bac Ninh and Hung Yen provinces, Vietnam. |
||||
|
Factor |
F1 |
F2 |
F3 |
F4 |
|
Eigen value |
4.771 |
2.535 |
1.580 |
1.066 |
|
Explained variance (%) |
39.76 |
21.12 |
13.16 |
8.88 |
|
Cumulative (%) |
39.76 |
60.88 |
74.04 |
82.93 |
|
Component |
Factor loadings |
|||
|
Al |
.32 |
.84 |
-.09 |
-.06 |
|
V |
-.17 |
.81 |
-.007 |
.28 |
|
Cr |
-.08 |
.040 |
.98 |
.03 |
|
Mn |
-.006 |
.58 |
-.006 |
-.52 |
|
Fe |
-.07 |
.85 |
.380 |
.09 |
|
Co |
.50 |
.68 |
.40 |
-.16 |
|
Ni |
.44 |
.14 |
.87 |
.03 |
|
Cu |
.97 |
.02 |
.061 |
.05 |
|
Zn |
.42 |
.17 |
.46 |
.23 |
|
Cd |
.65 |
-.03 |
.56 |
.39 |
|
Hg |
.25 |
.15 |
.11 |
.82 |
|
Pb |
.96 |
.05 |
.12 |
.17 |
Factor 1 is the strongest and explains 39.76% of the total variance with high contribution of Cu, Pb, Cd and Co. The important sources of elements included in Factor 1 can be considered traffic and industry (Grigalavičiene et al., 2005; Debnárová & Doležalová Weissmannová 2010). Both, Bac Ninh and Hung Yen provinces are major industrial centers of Vietnam with very high motorbike and car density compared to other provinces. The number of industrial centers and craft villages in these two provinces is also among the largest in the country. Factor 2 explains 21.12% of the total variance and the main contribution is coming from Fe (0.85), Al (0.84), V (0.81), Co (0.68 and Mn (0.58). Aluminum, Fe and Mn are the most abundant metals in the earth's crust (Berg et al., 1995). The remaining two elements V and Co can derive both from natural and industrial sources (De Foy et al., 2012; Wu et al., 2022). The co-occurrence of these five elements suggests that Factor 2 may be mainly associated with geological and industrial sources (Harmens et al., 2015).
Factor 3 represents 13.16 % of the total variance and is strongly contributed by two elements with very high loadings, namely Cr (0.98) and Ni (0.87). In several studies it was mentioned that these elements may be associated with traffic (Valavanidis et al., 2006; Urban et al., 2007) as well fossil fuels and petrochemical products combustion (Alexandrino et al., 2020). The link between Cr content in air stainless steel and yellow road markings in highways was found by Murakami et al., (2007). Therefore, Factor 3 is most likely associated with traffic related emission sources. To Factor 4 with 8.88 % of the total variance and mainly contribute Hg and slightly Cd. The average Hg content in moss samples (Table 2) was about 85 times higher than its average content in the earth's crust of 0.002 ppm (Canil et al. 2015). Mercury can be derived from both natural and anthropogenic sources, coal burning being the most significant (Yudovich & Ketris 2005; Zhou et al., 2017). In Bac Ninh and Hung Yen, many craft villages produce metal casting products using coal-fired furnaces. The simultaneous presence of both Hg and Cd may indicate on emissions from non-ferrous metallurgy (Lazo et al., 2022). Therefore, Factor 4 is related to man-made sources such non-ferrous metallurgy and other industrial activities as well as coal burning.
Contamination factor values were calculated to assess the level of air pollution and obtained results are given in Table 5.
|
Table 5. The contamination factors and pollution classification. |
||||||||||||
|
|
Al |
V |
Cr |
Mn |
Fe |
Co |
Ni |
Cu |
Zn |
Cd |
Hg |
Pb |
|
CF |
4.28 |
4.57 |
11.19 |
8.56 |
4.30 |
7.57 |
2.08 |
10.13 |
8.22 |
5.94 |
4.25 |
10.10 |
|
Pollution level |
C4 |
C4 |
C5 |
C5 |
C4 |
C4 |
C2 |
C5 |
C5 |
C3 |
C3 |
C5 |
Using the CF value of each element, the air pollution levels in the investigated area can be divided into 6 levels as follows: no pollution (C1) if CF≤ 1; suspected pollution (C2) if 127.
The preliminary conclusions about the air pollution status in the two provinces of Bac Ninh and Hung Yen are as follows: serious pollution with Cr, Mn, Cu, Zn and Pb; moderate pollution with Al, V, Fe and Co; slight pollution with Cd and Hg and suspected pollution with Ni. This is evident since both, Bac Ninh and Hung Yen provinces, possess many industrial parks and craft villages, which can emit determined elements.
4. CONCLUSIONS
The level of air pollution in Bac Ninh and Hung Yen provinces, located in the Red River Delta of northern Vietnam, was assessed using the moss biomonitoring technique. A total of 36 living moss samples of Barbula indica were collected from evenly distributed locations across the entire study area. The concentrations of 11 elements Al, V, Cr, Mn, Fe, Co, Ni, Cu, Zn, Cd, and Pb were analyzed using inductively coupled plasma optical emission spectroscopy (ICP-OES), while mercury (Hg) was determined using a dedicated mercury analyzer. The mean concentrations of Al, V, Cr, Mn, Fe, Co, Ni, Cu, Zn, Cd, Hg, and Pb in the moss samples were 5042, 12.0, 27.0, 222, 4899, 2.6, 11, 90, 537, 0.9, 0.17, and 52 mg/kg, respectively. Spatial distribution maps of these elements across Bac Ninh and Hung Yen provinces revealed several zones of severe contamination.
The corresponding contamination factors (CFs) for Al, V, Cr, Mn, Fe, Co, Ni, Cu, Zn, Cd, Hg, and Pb were 4.28, 4.57, 11.19, 8.56, 4.30, 7.57, 2.08, 10.13, 8.22, 5.94, 4.52, and 10.10, respectively. The pollution levels of Cr, Mn, Cu, Zn, and Pb were classified as very severe, while Al, V, Fe, and Co showed high levels of pollution. Cadmium and mercury exhibited moderate contamination.
Correlation and factor analyses identified urban dust, traffic emissions, and industrial activities as the main contributors to the release of potentially toxic elements (PTEs) into the atmosphere. The pollution levels were quantitatively assessed using contamination factors, which ranged from suspected contamination for Ni to very severe contamination for Cr, Mn, Cu, Zn, and Pb. These findings contribute valuable data to the national biomonitoring database of Vietnam. Given the country’s rapid economic development, it is recommended that regular biomonitoring studies be conducted nationwide to support air pollution prevention efforts.
Acknowledgments
We would like to express our gratitude to the staff of the Sector of Applied Research of the Laboratory of Neutron Physics (JINR) for ICP-OES analysis of moss samples. One of the authors (L.H. Khiem) highly acknowledges the Vietnam Academy of Science and Technology for support for senior researchers (Grant No. NVCC05.01/24-25). We acknowledge the critical comments from anonymous reviewers and editors. We would like to thank Da Lat University for partly supporting this research project.
Funding
This research received no specific grant from any funding agency in the public, commercial, or not-for-profit sectors.
REFERENCES
- Alexandrino, K., Viteri, F., Rybarczyk, Y., Guevara Andino, J. E., & Zalakeviciute, R., 2020. Biomonitoring of metal levels in urban areas with different vehicular traffic intensity by using Araucaria heterophylla needles. Ecol Indic 117:106701. https://doi.org/10.1016/j.ecolind.2020.106701
- Aničić Urošević, M., Ilić, M., Radnović, D., Vergel, K., Yushin, N., Chaligava, O., & Zinicovscaia, I., 2024. Comparative biomonitoring of airborne potentially toxic elements using mosses (Hypnum cupressiforme, Brachythecium spp.) and lichen (Evernia prunastri) over remote areas. Environ Sci Pollut Res 31:48296–48312. https://doi.org/10.1007/s11356-024-34353-z
- Anonymous, 2024a. Bac Ninh Province - TTTFIC GROUP. https://tttfic.com/province-city/bac-ninh-province/. Accessed 24 Dec 2024
- Anonymous, 2024b. BAC NINH province - a hi-tech development hotspot. https://vietnamlawmagazine.vn/bac-ninh-province-a-hi-tech-development-hotspot-5761.html. Accessed 24 Dec 2024
- Anonymous, 2024c. Manufacturing in Hung Yen, Vietnam: Key Advantages for Investors. https://www.vietnam-briefing.com/news/manufacturing-in-hung-yen-vietnam-key-advantages-and-2021-2030-master-plan.html/. Accessed 24 Dec 2024
- Anonymous, 2024d. Hung Yen Attracts Strong Foreign Investment in Vietnam in 2024. https://www.vietnam-briefing.com/news/hung-yen-emerging-foreign-investment-hub-vietnam-2024.html/. Accessed 24 Dec 2024
- Anonymous, 2024e. Introduction to the Industrial Parks in Bac Ninh - B-Company. https://b-company.jp/introduction-to-the-industrial-parks-in-bac-ninh/. Accessed 24 Dec 2024
- Anonymous, 2024f. Hung Yen established a series of industrial clusters. https://hungyengroup.com/hung-yen-established-a-series-of-industrial-clusters-with-a-total-capital-of-nearly-1200-billion-vnd. Accessed 24 Dec 2024
- Baczewska-Dąbrowska, A. H., Gworek, B., Dmuchowski, W., 2023. The Use of Mosses in Biomonitoring of Air Pollution in the Terrestrial Environment: A Review. Environmental Protection and Natural Resources 34:19–30. https://doi.org/10.2478/oszn-2023-0005
- Berg, T., Røyset, O., Steinnes, E., & Vadset, M., 1995. Atmospheric trace element deposition: Principal component analysis of ICP-MS data from moss samples. Environ Pollut 88:67–77. https://doi.org/10.1016/0269-7491(95)91049-q
- Canil, D., Crockford, P. W., Rossin, R., & Telmer, K., 2015. Mercury in some arc crustal rocks and mantle peridotites and relevance to the moderately volatile element budget of the Earth. Chem Geol 396:134–142. https://doi.org/10.1016/j.chemgeo.2014.12.029
- Cesa, M., Baldisseri, A., Bertolini, G., Dainese, E., Col, M. D., Vecchia, U. D., Marchesini, P., & Nimis, P. L. 2013. Implementation of an active “bryomonitoring” network for chemical status and temporal trend assessment under the Water Framework Directive in the Chiampo Valley’s tannery district (NE Italy). J Environ Manage 114:303–315. https://doi.org/10.1016/j.jenvman.2012.10.022
- De Foy, B., Smyth, A. M., Thompson, S. L., Gross, D. S., Olson, M. R., Sager, N., & Schauer, J. J., 2012. Sources of nickel, vanadium and black carbon in aerosols in Milwaukee. Atmos Environ 59:294–301. https://doi.org/10.1016/j.atmosenv.2012.06.002
- Debnárová, A., & Doležalová Weissmannová, H., 2010. Assessment of Heavy Metal Pollution (Cd, Cu, Pb, Hg) in Urban Soils of Roadsides in Brno. Trans Transp Sci 3:147–156. https://doi.org/10.2478/v10158-010-0021-1
- Doan Phan, T. T., Trinh, T. T., Khiem, L. H., Frontasyeva, M. V., & Quyet, N. H., 2019. Study of Airborne Trace Element Pollution in Central and Southern Vietnam Using Moss (Barbula indica) Technique and Neutron Activation Analysis. Asia-Pacific J Atmos Sci 55:247–253. https://doi.org/10.1007/s13143-018-0065-4
- Fernández, J., & Carballeira, A., 2001. A comparison of indigenous mosses and topsoils for use in monitoring atmospheric heavy metal deposition in Galicia (northwest Spain). Environ Pollut 114:431–441. https://doi.org/10.1016/S0269-7491(00)00229-3
- Frontasyeva M., Harmens H., Uzhinskiy A., Omar C. and participants of the moss survey, 2020. Mosses as biomonitors of air pollution: 2015/2016 survey on heavy metals, nitrogen and POPs in Europe and beyond. Report of the ICP Vegetation Moss Survey Coordination Centre
- Gaza T., & Kugara J., 2018. Study of Heavy Metal Air Pollution, Using a Moss (Grimmia dissimulate) Biomonitoring Technique. Univers J Chem 6:1–13. https://doi.org/10.13189/ujc.2018.060101
- Giordano S., Spagnuolo V., & Capozzi F., 2021. Biomonitoring of air pollution. Atmosphere (Basel). 12:433
- Grigalavičiene I., Rutkoviene V., & Marozas V., 2005. The accumulation of heavy metals Pb, Cu and Cd at roadside forest soil. Polish J Environ Stud 14:109–115
- Harmens, H., Norris, D., Sharps, K., Mills, G., Alber, R., Aleksiayenak, Y., Blum, O., Cucu-Man, S., Dam, M., De Temmerman, L., Ene, A., Fernández, J., Martinez-Abaigar, J., Frontasyeva, M., Godzik, B., Jeran, Z., Lazo, P., Leblond, S., Liiv, S., …& Zechmeister, H., 2015. Heavy metal and nitrogen concentrations in mosses are declining across Europe whilst some “hotspots” remain in 2010. Environ Pollut 200:93–104. https://doi.org/10.1016/j.envpol.2015.01.036
- Hoang, V. T., & Gheorghe C., G. C., 2019. Depositional environment during Holocene of the Red River delta, northern Vietnam. Carpathian Journal of Earth and Environmental Sciences, 14(2), 301-310. https://doi.org/10.26471/cjees/2019/014/081
- Hung, NT, Kosinova, I. I., & Đang, T. L., 2020. Modeling air pollution in Dong Nai Province, Vietnam. Geogr Environ Sustain 13:166–174. https://doi.org/10.24057/2071-9388-2019-44
- Janse, R. J., Hoekstra, T., Jager, K. J., Zoccali, C., Tripepi, G., Dekker, F. W., & Van Diepen, M., 2021. Conducting correlation analysis: Important limitations and pitfalls. Clin. Kidney J. 14:2332–2337. https://doi.org/10.1093/ckj/sfab085.
- Khiem, L. H., Sera, K., Hosokawa, T., Nam, L. D., Quyet, N. H., Frontasyeva, M., My, T. T., My, N. T., Zinicovscaia, I., Nghia, N. T., Trung, T. D., Hong, K. T., Mai, N. N., Van Thang, D., Son, N. A., Thanh, T. T., & Xayheungsy, S., 2020b. Active moss biomonitoring technique for atmospheric elemental contamination in Hanoi using proton induced X-ray emission. J Radioanal Nucl Chem 325:515–525. https://doi.org/10.1007/s10967-020-07253-y
- Khiem, L. H., Sera, K., Hosokawa, T., Quyet, N. H., Frontasyeva, M. V., Trinh, T. T., My, N. T., Nghia, N. T., Trung, T. D., Nam, L. D., Hong, K. T., Mai, N. N., Thang, D. V., Son, N. A., Thanh, T. T., & Tien, D. P., 2020a. Assessment of atmospheric deposition of metals in Ha Noi using the moss bio-monitoring technique and proton induced X-ray emission. J Radioanal Nucl Chem 324:43–54. https://doi.org/10.1007/s10967-020-07066-z
- Khiem, L. H., Zinicovscaia, I., My, T. T., Frontasyeva, M., My, N. T., Son, N. A., Van Trung, D., Nam, L. D., Sang, N. T., Duy, N. N., Hung, N. Q., Van Hai, B., Mai, N. N., Thang, D. D., & Dinh, N. T., 2022. Investigation of airborne trace element pollution in Hai Phong city (Vietnam) using Barbula Indica moss and neutron activation analysis. J Radioanal Nucl Chem 331:4649–4662. https://doi.org/10.1007/s10967-022-08567-9
- Krupnova, T. G., Rakova, O. V., Gavrilkina, S. V., Antoshkina, E. G., Baranov, E. O., & Yakimova, O. N., 2020. Road dust trace elements contamination, sources, dispersed composition, and human health risk in Chelyabinsk, Russia. Chemosphere 261:127799. https://doi.org/10.1016/j.chemosphere.2020.127799
- Lazo, P., Kika, A., Qarri, F., Bekteshi, L., Allajbeu, S., & Stafilov, T., 2022. Air Quality Assessment by Moss Biomonitoring and Trace Metals Atmospheric Deposition. Aerosol Air Qual Res 22:. https://doi.org/10.4209/AAQR.220008
- Lazo, P., Shehu Kane, S., Qarri, F., Allajbeu, S., & Bekteshi, L., 2024. 15 Years of Moss Biomonitoring for Air Quality Assessment in Albania. Aerosol Air Qual Res 24:. https://doi.org/10.4209/aaqr.240011
- Murakami, M., Nakajima, F., Furumai, H., Tomiyasu, B., & Owari, M., 2007. Identification of particles containing chromium and lead in road dust and soakaway sediment by electron probe microanalyser. Chemosphere 67:2000–2010. https://doi.org/10.1016/j.chemosphere.2006.11.044
- Nguyen T. L., 2020. Environmental pollution in Vietnam’s craft villages. In: E3S Web of Conferences
- Nguyen, T. M. S, Nguyen, A. S., Khiem, L. H., Le, T. T., Tran, T. A., Ho, H. T., Zinicovscaia, I., Frontasyeva, M., Le, D. N., & Nguyen, T. X., 2023. Investigation of Elemental Deposition in Lamdong Province (Vietnam) by the Moss Biomonitoring Method and Neutron Activation Analysis. Commun Phys 33:329. https://doi.org/10.15625/0868-3166/18266
- Nguyen, T. T. N., Vu, T. D., Vo, D. N., Tran, M. D., Le, T. H., Tran, T. T. H., Pham, M. K., Ngo, X. T., Nguyen, T. N. T., Jegasothy, E., Marks, G. B., Morgan, G., 2022. Mortality benefits of reduction file particulate matter in Vietnam, 2019. Front. Public Health 10. https://doi.org/10.3389/fpubh.2022.1056370
- Nurkassimova, M., Omarova. N., Yushin, N., Grozdov, D., Vergel, K., Zinicovscaia, I., 2024. Assessment of air pollution in South Kazakhstan using moss (Hylocomium splendens) biomonitoring technique and neutron activation analysis. J Radioanal Nucl Chem 333:4367–4376. https://doi.org/10.1007/s10967-024-09562-y
- Quyet, N. H., Khiem, L. H., My, T. T. T., My, N. T. B., Frontasieva, M., Zinicovscaia, I., Son, N. A., Thanh, T. T., Nam, L. D., Hong, K. T., Mai, N. N., Trung, D. V., Thang, D. V., Hang, N. T. T., 2021. Biomonitoring of chemical element air pollution in hanoi using barbula indica moss. Environ Eng Manag J 20:791–800. https://doi.org/10.30638/eemj.2021.074
- Singh, D., Dahiya, M., Kumar, R., & Nanda, C., 2021. Sensors and systems for air quality assessment monitoring and management: A review. J. Environ. Manage. 289:112510
- Son, N., Khiem, L., Sang, N., Tien, D., & Thang, H., 2021. Determination of Elements due to Atmospheric Deposition on Barbula indica Moss at Dalat, Vietnam using NAA and TXRF Techniques. Sains Malaysiana 50:1531–1541. https://doi.org/10.17576/jsm-2021-5006-03
- Thakur, M., Bhardwaj, S., Kumar, V., & Rodrigo-Comino, J., 2024. Lichens as effective bioindicators for monitoring environmental changes: A comprehensive review. Total Environ Adv 9:200085. https://doi.org/10.1016/j.teadva.2023.200085
- Thomaidis, N. S., Bakeas, E. B., & Siskos, P. A., 2003. Characterization of lead, cadmium, arsenic and nickel in PM2.5 particles in the Athens atmosphere, Greece. Chemosphere 52:959–966. https://doi.org/10.1016/S0045-6535(03)00295-9
- Tien, D. P., My, T. T., Khiem, L. H., Frontasyeva, M., Zinicovscaia, I., Son, N. A., & Van Dung, D., 2022. Studying airborne trace elements in featured areas in Red River Delta and South Central Vietnam using moss biomonitoring technique and neutron activation analysis. J Radioanal Nucl Chem 331:2743–2750. https://doi.org/10.1007/s10967-022-08331-z
- Turetsky, M. R., 2003. The role of bryophytes in carbon and nitrogen cycling. The Bryologist, 106(3), 395-409. https://doi.org/10.1639/05
- Urban H., Hübner C., & Ellinger R., 2007. Road traffic emission factors for PAH, heavy metals, primary NO2 and further particulate and gaseous components. Gefahrstoffe Reinhaltung der Luft 67:429–438
- Valavanidis, A., Fiotakis, K., Vlahogianni, T., Bakeas, E. B., Triantafillaki, S., Paraskevopoulou, V., & Dassenakis, M., 2006. Characterization of atmospheric particulates, particle-bound transition metals and polycyclic aromatic hydrocarbons of urban air in the centre of Athens (Greece). Chemosphere 65:760–768. https://doi.org/10.1016/j.chemosphere.2006.03.052
- Vergel, K., Zinicovscaia, I., Yushin, N., Chaligava, O., Cepoi, L., Kravtsova, A., 2024. Moss Biomonitoring in the Tver region, Russia. Atmosphere 15:1191; https://doi.org/10.3390/atmos15101191
- WHO, 2018. Air pollution in Viet Nam. World Heal. Organ. 1–4
- Wu, Y., Liu, Q., Ma, J., Zhao, W., Chen, H., & Qu, Y., 2022. Antimony, beryllium, cobalt, and vanadium in urban park soils in Beijing: Machine learning-based source identification and health risk-based soil environmental criteria. Environ Pollut 293:118554. https://doi.org/10.1016/j.envpol.2021.118554
- Yudovich Y. E., Ketris M.P., 2005. Mercury in coal: A review. Part 1. Geochemistry. Int. J. Coal Geol. 62:107–134
- Zeller RA, 2004. Measurement Error, Issues and Solutions. In: Encyclopedia of Social Measurement, Three-Volume Set. Elsevier, pp V2-665-V2-676
- Zhou, X., Chen, Q., Liu, C., Fang, Y., 2017. Using moss to assess airborne heavy metal pollution in Taizhou, China. Int J Environ Res Public Health 14:430. https://doi.org/10.3390/ijerph14040430
- Zinicovscaia, I., Chaligava, O., Yushin, N., Grozdov, D., Vergel, K., Hrarmco, C., 2022. Moss Biomonitoring of Atmospheric Trace Element Pollution in the Republic of Moldova. Arch Environ Contam Toxicol 82: 355–366. https://doi.org/10.1007/s00244-022-00918-7