1. INTRODUCTION
Floods are one of the most frequent and common disasters in the world. Flood disasters have been recorded as the most common cause of casualties and economic loss because of their higher frequency and vast area coverage (Madhuri et al., 2015). The unregulated process of infrastructure development is a major cause of urban flooding and has the highest risk due to higher population density (Aydin & Sevgi Birincioğlu, 2022; Okyere et al., 2013). Flood vulnerability includes displacement, casualties, crop damage and environmental degradation, responsible for billions of dollars of economic loss worldwide (Rozalis et al., 2010). In the year 2022, out of 321 disasters, floods had the highest frequency of 163 and out of 30759 casualties, 26.17 % of deaths were caused by floods worldwide. A total of 5.75 million people is affected by the floods and the estimated economic loss is 44.9 billion dollars. The frequency of floods has increased by 14 % in the last 30 years (2022 Global Natural Disaster Assessment Report, 2023). According to the Preparation of state disaster plan (2007), over 40 million hectares of land in India are flood-prone.
Floods have hazardous consequences for a nation. Climate change has accelerated the frequency of flood occurrences in the recent century (Singh et al., 2014). Floods, coupled with climate change, threaten agricultural production and the livelihood of farmers. It also disrupts the production cycle, posing socio-economic challenges to a nation (Matheswaran et al., 2019). Floods also degrade the soil quality through waterlogging, resulting in a sharp decline in agricultural production, which further poses the challenge of food insecurity (Watanabe et al., 2018). Chau et al. (2013) found a significant impact of flood duration and level of inundation on agricultural production. Madhuri et al. (2016) have found that people in rural Bihar are worried about the adverse impacts of floods on their previous experiences and have their own preparedness and adaptive measures. Preparedness and adaptive measures are key determinants to minimize the catastrophic impacts of floods. Turay (2022) analyzed that the impacts of floods intensify under the conditions of poor preparedness and inadequate adaptive measures. Ahmad & Afzal (2024) have noticed that males are dominating the decision-making about disaster risk adaptation strategy, so that women are more vulnerable to the hazards and communities with less information about floods also have higher vulnerability. The small and marginal farmers are more susceptible than medium and large farmers, as depicted by Ahmad & Afzal (2022). Hoque (2023) has advocated that women farmers are more vulnerable to flood hazards as they have less awareness about this disaster and low educational attainment.
Flood vulnerability assessment is an important parameter to quantify the flood risk of a particular community in any specific area. Vulnerability is a measurement of the likelihood of being damaged by any hazard (Balica et al., 2009). The vulnerability is considered to be the function of three major components: exposure, susceptibility or sensitivity and resilience or adaptability (Dottori et al., 2018). Kumar & Chyrmang (2022) have estimated the flood vulnerability of each district of Bihar and found that most of north Bihar is mostly vulnerable to floods. Kumar & Pradhan (2024) have also depicted the flood vulnerability of Bihar, but they also found that the accuracy of flood vulnerability calculation depends on how precisely the indicators have been selected for all three components. Erena & Worku (2019) highlighted the importance of flood vulnerability assessment in flood hazard management and argued that using flood vulnerability, preparedness and mitigation strategies can be improved to minimize the adverse impact of floods. Nasiri et al. (2019), Mukta et al. (2022) and Kumar & Pradhan (2024) have concluded that social, economic, physical and environmental vulnerability is directly associated with the flood vulnerability of that respective geographical trait.
The above-mentioned studies have presented the spatio-temporal analysis of flood vulnerability at the macro level (country, state and district). Furthermore, studies have also incorporated socio-economic factors to assess flood vulnerability and proposed a general flood mitigation plan. However, there is a lack of vulnerability information at the micro level (village) with the inclusion of socio-economic and demographic features. The zonal analysis using primary as well as secondary information is also missing in the previous works and will be highlighted in the present work. This study will also present a more extensive and inclusive flood mitigation model for each zone individually. Based on the statement of the problem and research gap, this study aims to explore the following objectives:
A. to analyze the overall flood vulnerability of selected villages in the Biraul Sub-division of Bihar.
B. to propose a strategic model of flood management for high, moderate and less vulnerable villages in the Biraul Sub-division of Bihar.
2. MATERIALS AND METHODS
2.1. Study Area
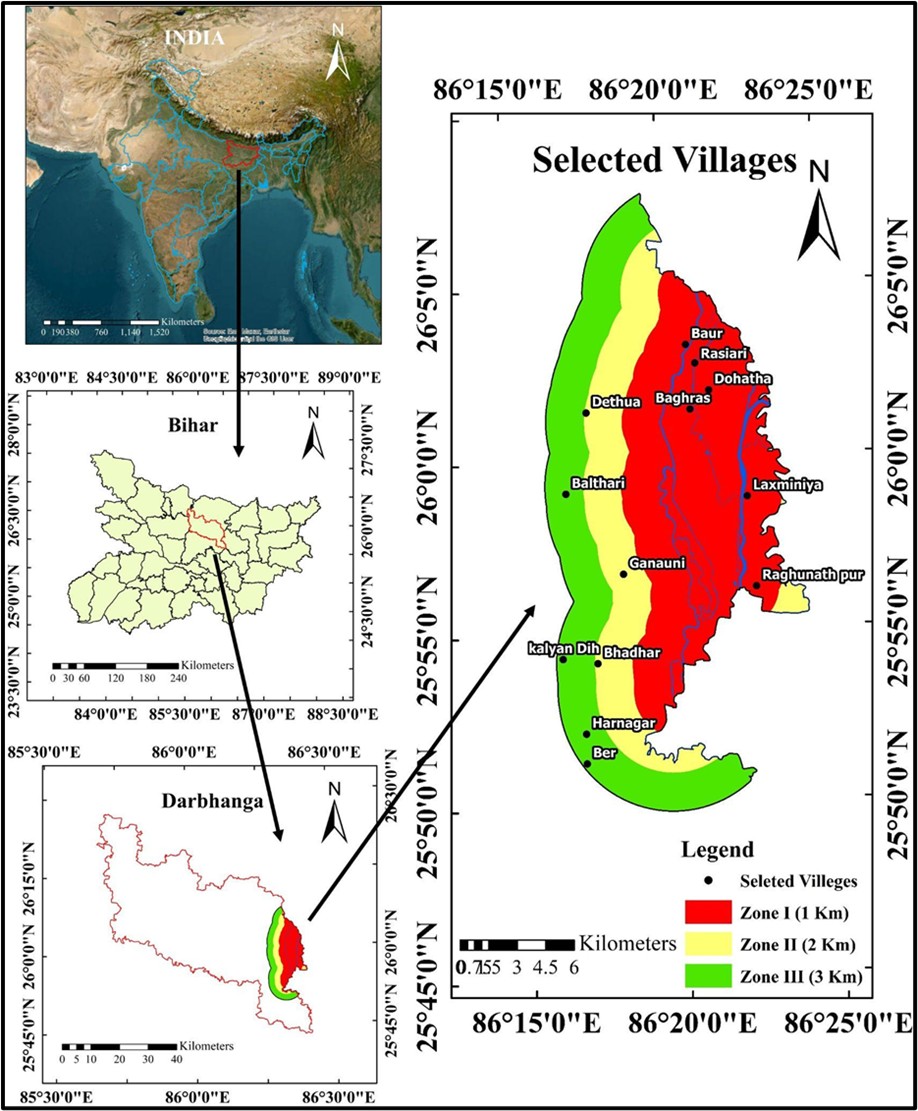
The study is conducted on the Biraul sub-division of the Darbhanga District of Bihar. The district is located between 25° 31' 48'' N to 26° 16' 12'' N and 85° 24' E to 86° 15' E. It is surrounded by the Madhubani from the north, Samastipur from the south, Saharsa from the east and Sitamarhi and Muzaffarpur from the west. The total area of the district is 2504 km2. According to a report of the Central Groundwater Board authored by Nayak (2023), a total of 79 % area is under the net sown category, while 11 % is wasteland, followed by 10 % of land under the other uses. The average cropping intensity of the district is 148 %. According to the 2011 census, the total population of the district is 3937385, including 2059949 males and 1877436 females. The vast alluvial plain of the Baghmati River basin, with a gentle slope from north to south, is the key geomorphological characteristic of the district. The maximum elevation from the mean sea level is 52.50 m and the lowest point is 41.08 m elevated, located in the northern and south-eastern part of the district, respectively. The soil is highly calcareous, a mixture of clay, sand and silt. This district is located in the Middle Gangetic agro-climate region. May is the hottest month with the highest temperature of 42 °C. The district receives an average rainfall of 1142.3 mm from south southwest monsoon between the middle of June to September. Administratively, this district is divided into three subdivisions- Darbhanga, Benipur and Biraul. This study has been carried out in the Biraul sub-division.
2.1.1. Scenario of Floods in Bihar State
Bihar is one of the most flood-affected states in India. A total of 28 districts out of 38 districts in Bihar are flood-affected, out of which 15 are the most vulnerable. According to a survey, the flood-affected areas have doubled in the last 60 years (Shah, 2013). The flood affects an average of 36 % of the state's population, which accounts for 23 % of the total economic damage in the country. Bagmati, Budhi Gandak, Koshi, and Kamala-Balan are the major rivers, responsible for the flood disaster promoted by the low-lying area, heavy rainfall and poor flood management in north Bihar (Singh, 2021). Singh & Singh (2008) have observed that the frequency and vulnerability of floods have paradoxically increased with the number of embankments in Bihar, because embankments promote silt buildup, raising riverbeds and blocking natural drainage. The embankment breaching by the rivers is the major cause of floods in the state (Shrestha et al., 2010). More than 70 % of the area of north Bihar is affected by river inundation. There are more than 3400 km of embankment in the state, which increased from 160 km in the year 1954. The episodic shift in the channel of some rivers, like the Kosi, is due to sedimentation at the mouth of the channel, causing devastating floods in Bihar (Bhatt et al., 2010; Kale, 2008). The recent trends of total economic damage, numbers of affected blocks, panchayats, villages, persons and animals are given in the following Table 1. Data implies that in the years 2016, 2017, 2019, 2020 and 2021, Bihar was adversely affected by the floods.
|
Table 1. Estimated damage from floods in Bihar (Source: Disaster Management Department, GoB, 2024). |
|||||||||
|
Year |
Numbers of Affected |
Total area |
Total houses damaged |
Total economic loss in ₹000 |
|||||
|
No. of Blocks |
Panchayats |
Villages |
Persons in 000 |
Animals in 000 |
Total cropped area in 000 H |
Total area in 000 H |
|||
|
2015 |
32 |
94 |
237 |
4850 |
140 |
90 |
120 |
518 |
72380 |
|
2016 |
185 |
1408 |
5527 |
8785000 |
7700 |
7100 |
43300 |
69102 |
67629400 |
|
2017 |
214 |
2605 |
9197 |
185000 |
16000 |
3000 |
30000 |
263848 |
156803000 |
|
2018 |
15 |
63 |
181 |
1500 |
260 |
100 |
340 |
1074 |
561980 |
|
2019 |
238 |
2130 |
7257 |
149410 |
11720 |
3570 |
1061000 |
45161 |
64209900 |
|
2020 |
152 |
1402 |
7334 |
100230 |
4750 |
5170 |
7720 |
18775 |
402144780 |
|
2021 |
295 |
2865 |
6609 |
82570 |
4750 |
6540 |
9950 |
12289 |
644485740 |
|
2022 |
67 |
346 |
710 |
4510 |
380 |
570 |
510 |
1744 |
5513430 |
|
2023 |
14 |
81 |
241 |
3160 |
430 |
- |
- |
737 |
356600 |
|
LH: Lac hectare |
|||||||||
2.1.2. Flood Situation in Darbhanga District
Darbhanga is one of the most flood-affected districts of Bihar and falls in a very high flood-risk zone (Matheswaran et al., 2019). Jha & Gundimeda (2019) also observed high flood vulnerability risk in the Darbhanga district between 1987 and 2016. Bagmati, Kamala-Balan, Khiroi, Kareh and Awadhara are the major groups of rivers that cause severe floods in the district (Kumar & Chyrmang, 2022). The river Bagmati drains in the western part of the district, while the river Kamala-Balan flows in the eastern part. Out of the total area of the Kamala-Balan basin in Bihar, 82 % of the area falls under the flood-prone zone. The frequency and severity of floods in recent years are given in Table 2. This area receives a maximum rainfall of 155 cm in August, followed by July and September (Singh et al., 2010). The district experienced severe flooding during the years 2017, 2020 and 2021 due to higher rainfall, while in the years 2018 and 2022 the district was unaffected because of weaker monsoons. Sahani et al. (2023) found that a set of factors, like breaching of embankments by the rivers other than the local rainfall in the catchment, trigger floods in the district. According to the Bihar State Disaster Management Authority, there are 11 sensitive river embankments in the district. More than 80 % area of the district faced a flood at least once in the last four years (Singh et al., 2014; Bali & Pathak, 2021). The blocks Kiratpur, Gaurabauram, Kushweshwarsthan, Kushweshwarsthan Purvi and Ghanshyampur are affected by floods. After the flood, waterlogging in the district lasts for 3 to 5 months (Tripathi et al., 2020).
|
Table 2. Estimated damage from the flood in Darbhanga District (Source: Disaster Management Department, GoB, 2024). |
|||||||||
|
Year |
Number of Affected |
Total area |
Total houses damaged |
Total economic loss in ₹000 |
|||||
|
No. of Blocks |
Panchayats |
Villages |
Persons in 000 |
Animals in 000 |
Total cropped area in 000 H |
Total area in 000 H |
|||
|
2015 |
5 |
13 |
41 |
1250 |
130 |
120 |
- |
4 |
3800 |
|
2016 |
5 |
36 |
77 |
- |
- |
20 |
210 |
6 |
2110 |
|
2017 |
18 |
280 |
1061 |
23870 |
1950 |
600 |
14240 |
10243 |
480000 |
|
2019 |
18 |
224 |
850 |
22900 |
1270 |
360 |
1470 |
2777 |
718500 |
|
2020 |
16 |
234 |
1184 |
26170 |
1380 |
700 |
700 |
4053 |
44150000 |
|
2021 |
17 |
252 |
581 |
14470 |
200 |
400 |
480 |
405 |
43720000 |
|
2023 |
2 |
5 |
18 |
290 |
30 |
- |
- |
- |
268510 |
|
LH: Lac hectares |
|||||||||
2.2. Methods
The Kamala-Balan River flows into the eastern part of the Darbhanga District along the border between the Darbhanga and the Madhubani districts. The shapefile of this river has been generated and digitized from Google Earth Pro. The study area was clipped from the river shape. Three buffer zones of one kilometer have been created. A total of 54 villages, 33 villages and 40 villages are located in zone one, zone two and zone three, respectively. All the processes mentioned above are done on ArcMap 10.3 and SPSS software. The location of the study area is given in Figure 1.
This study is based on primary as well as secondary data sources. The stratified random sampling method has been adopted to collect the primary data. In the next step, a 10 % village has been selected from each zone. Six villages from the highly vulnerable zone, 3 villages from the moderately vulnerable zone and 4 villages from the low vulnerable zone have been selected randomly for the primary survey. 260 households (20 from each village) are selected randomly. Oral consent was taken from the respondents on using the information for research purposes and they were also free to deny answering any question or quit from the survey anytime. Secondary data has been collected from the mukhiya of gram panchayats and block development offices.
2.3. Data Analysis
A total of 17 demographic and socio-economic indicators has been taken and each indicator was subdivided into variables. The responses of the respondents are given in absolute numbers and %age in brackets. Details are given in Table 4 in Section 3.1. The demographic and socio-economic variables have been chosen deliberately according to the requirements of the study. Variables like the type of road to the house, distance to main road and distance to police station are significant for a flood-prone region, also included in the study.
A composite flood vulnerability (FV) has been computed individually for all 13 villages. 67 variables of all three components (Exposure, Susceptibility and Resilience) of FV were selected from the previous literature and proposed by the United Nations. All the indicators were grouped into 26 major indicators of all three components and converted into the same unit. The grouped variables were normalized on a scale of 0 to 1 using Equation 1 given below and assigned equal weights to each indicator based on its subjectivity (Nguyen & Van Nguyen, 2019).

where, Yai = the normalized value of indicator i for village a, lies between 0 to 1; Xai = value of indicator i for the village a; 1 represents the village with the maximum value for indicator i and 0 refers to the village with the minimum value for indicator i.
The average value of all indicators of each component has been obtained for each village separately using Equation 2 given below (Kumar & Chyrmang, 2022).

where, ev = average of components for village v; indexevi represents the normalized value of an indicator i for the village v; n represents the number of indicators in a particular component.
Furthermore, the FV has been calculated through the formula (Equation 3) previously used by (Erena & Worku, 2019; Nguyen & Van Nguyen, 2019).

2.4. Inverse Distance Weighting (IDW) Interpolation
IDW is a widely used geographical interpolation method. It is a deterministic method which estimates the values of unnamed locations based on known values of the surrounding points (Bartier & Keller, 1996). IDW is one of the best spatial interpolation methods when the data points are unevenly distributed. The IDW is calculated through the following Equation 4. This method uses the values of known points as a reference to estimate the values of nearby unknown points (Harman et al., 2016). In this study, values of all three components of FV and overall FV for all 13 surveyed villages have been used as a reference point to estimate the values of their nearby villages. The accuracy of the predicted values for the unknown points depends on the uniform distribution of reference points over the geographical area (Almasi et al., 2014). The output of IDW has been categorized into three classes for the zonal classification of the study area according to their vulnerabilities.

where, Z0 = the estimated value for the unknown location is 0; N = total number of known points; zi= value of the known point I; wi = weight assigned to the known point based on its distance to an unknown location 0.
The weight is calculated by using Equation 5 given below (Ikechukwu et al., 2017):

where, wi = weight assigned to a known location I; d = distance of the known point to the known points, p = value of the power parameter. The value of the power parameter determines the accuracy of IDW interpolation (Qiao et al., 2019).
3. RESULTS AND DISCUSSION
Table 3 represents all three components of vulnerability, which are further subdivided into indicators like E1, S1, R1, and so on. Code E denotes the indicators related to the component exposure, as the S and R codes are dedicated to the susceptibility and resilience components. In the next column, the unit of that particular indicator is represented and in the last column, its positive (+) or negative (˗) relationship with the vulnerability is given. A total of 9 indicators for exposure, 8 for susceptibility, and 9 for resilience were selected based on expert opinions and the inclusion of opinions of group discussions from the collected primary data.
|
Table 3. Components and indicators to measure the flood vulnerability (Source: designed by Authors, 2024). |
|||
|
Components |
Indicators (Code) |
Unit |
Relationship with the vulnerability |
|
Exposure |
Flood-affected households (E1) Flood frequency (E2) Proximity to the river stream (E3) Duration of inundation (E4) Flood water level (E5) Proximity to the main road (E6)
Proximity to the Police Station (E7) Proximity to the hospital (E8) |
% of HH affected by flood Number of flood events in the last five years % of HH closer than 1 km to the river stream % of HH with more than 2 months of inundation % of HH with more than 2m of flood water % of households with more than 5 km away from the nearest main road % of HH with more than 5 km away from the nearest police station % of HH with a distance of more than 5 km from the nearest hospital |
+ + + + + +
+
+ |
|
Susceptibility |
Large HH (S1) Female (S2) Children (S3) Old age (S4) Illiterates (S5) Poor (S6) Farmers (S7) Poor housing (S8) Agriculture (S9) |
% of HH with more than 7 members % of females in the village % of the population under 15 in the village % of the population over 60 in the village % of the illiterate population in the village % of HH living below the poverty line % of HH depends on agriculture % of HH living in the Kutcha houses % of the agricultural land of the village in the flood area |
+ + + + + + + + + |
|
Resilience |
Support from DDMA (R1)
Awareness (R2)
Housing (R3) Training (R4)
Swimming skill (R5) Warning system (R6) Financial capacity (R7)
Compensation (R8) Community participation (R9) |
% of HH considered the effectiveness of DDMA to be important/very important % of HH have the highest knowledge of flood management % of HH residing in pucca houses % of HH with minimum member trained by the DDMA/SDMA/NDMA % of people can swim % of HH aware of the flood warning system % of HH with the highest income (more than 500000 per annum) % of HH compensated by the government % of HH considered the role of community participation in flood disaster management |
-
-
- -
- - -
- - |
|
Table 4. Socio-economic profile of the respondents (Source: Field Survey, 2024). |
||||
|
Sr. no. |
Indicators |
Variables |
Numbers (%age) |
Totals |
|
1. |
Gender |
Male Female |
231 (89) 29 (11) |
260 (100) |
|
2. |
Age (in Years) |
0 to 15 16 to 59 60+ |
0 (0) 200 (77) 60 (23) |
260 (100) |
|
3. |
Marital Status |
Married Unmarried |
235 (90) 25 (10) |
260 (100) |
|
4. |
Religion |
Hindu Muslim |
248 (95) 12 (5) |
260 (100) |
|
5. |
Caste |
General EWS OBC SC/ST |
56 (21) 60 (23) 104 (40) 40 (16) |
260 (100) |
|
6. |
Economic status |
APL BPL |
68 (26) 192 (74) |
260 (100) |
|
7. |
Education |
Illiterate Less than 8th 9th to 12th Graduate Postgraduate Professional Degree |
99 (38) 60 (23) 49 (19) 35 (14) 12 (4) 5 (2) |
260 (100) |
|
8. |
Occupations |
Unemployed Farming Labourers Retail shop Government Job Private job |
16 (6) 176 (67) 40 (16) 16 (6) 8 (3) 4 (2) |
260 (100) |
|
9. |
Annual income (in ₹000) |
Less than 100 100 to 200 200 to 500 More than 500 |
177 (68) 33 (12) 30 (11) 20 (9) |
260 (100) |
|
10. |
Family type |
Joint Nuclear |
205 (79) 55 (21) |
260 (100) |
|
11. |
Cooking energy |
LPG Woods and Cow dung cakes Both |
85 (33) 29 (11) 146 (56) |
260 (100) |
|
12. |
Drinking Water |
Ground Water Well Tap (Multiple sources) |
157 (61) 12 (4) 91 (35) |
260 (100) |
|
13. |
Housing conditions |
Kutcha Pucca Mixed |
105 (40) 27 (10) 128 (50) |
260 (100) |
|
14. |
Road to the house |
Unpaved Road Damar Bricks RCC |
100 (38) 54 (21) 82 (31) 24 (10) |
260 (100) |
|
15. |
Distance to main road (in Km) |
<1 1 to 3 3 to 5 5< |
24 (10) 60 (23) 72 (27) 104 (40) |
260 (100) |
|
16. |
Distance to the police station (in Km) |
<1 1 to 3 3 to 5 5< |
25 (10) 57 (22) 66 (25) 112 (45) |
260 (100) |
|
17. |
Distance to the Hospital (in Km) |
<1 1 to 3 3 to 5 5< |
27 (10) 48 (18) 30 (11) 155 (61) |
260 (100) |
3.1. Demographic and socio-economic features of the respondents
This section deals with the demographic, social and economic specifications of all 260 selected respondents across the 13 villages located in the study area.
The surveyed population consists predominantly of males (89 %) and individuals aged 16 to 59 years (77 %). Most of the respondents are married (90 %) and follow Hinduism (95 %). In terms of caste distribution, other backward classes (OBCs) which are 40 %, form the largest group, followed by economic weaker section (EWS) of 23 %, General (21 %) and schedule casts and schedule tribes (SC/ST) of 16 %. A significant portion (74 %) falls under the Below Poverty Line (BPL) category, while the state average of around 52 %, indicating economic vulnerability. The education levels are low, with 38 % being illiterate, higher than the state average of 27 % and only 20 % attaining graduate or higher degrees. Farming is the primary occupation for 67 % of respondents and 68 % earn less than ₹100 thousand annually (Lerche, 1998). Most of the families follow a joint family structure (79 %). Regarding the household infrastructure, 56 % use both LPG and traditional biomass for cooking, 61 % rely on groundwater for drinking and 50 % have mixed housing conditions. Road connectivity remains a challenge, with 38 % having unpaved roads and 40 % living more than 5 km from the main road. Additionally, access to essential services is limited, as 45 % live over 5 km from the police station and 61 % from a hospital more challenging as compared to Bihar’s average rural hospital accessibility within 3 to 5 km. These disparities intensify during the flooding.
3.2. Flood vulnerability
3.2.1. Exposure of villages to the floods
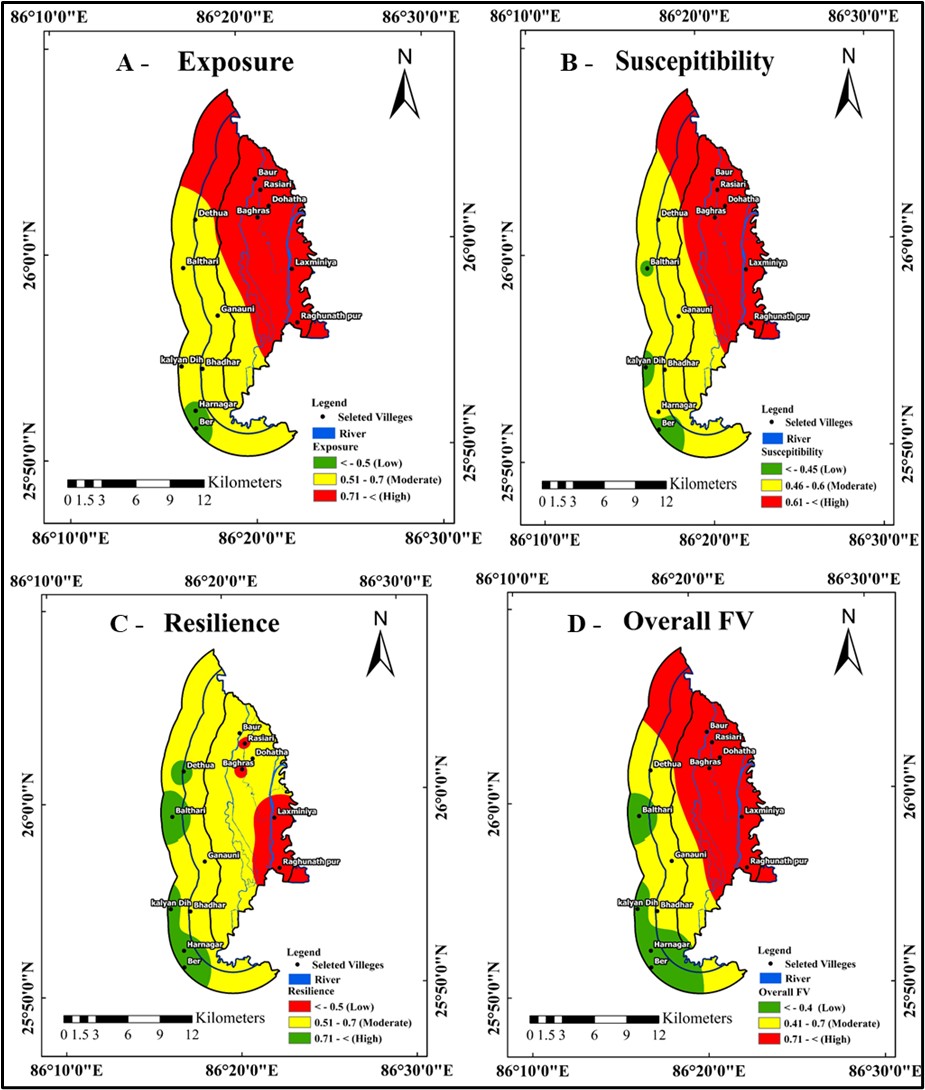
This section refers to the quantification of exposure for each village separately. The normalized weighted value for each indicator of the exposure component, denoted by E, is given in columns and the average of all indicators related to a specific village is denoted by E* and shown in the last column in Table 5 (Figure 2A). Villages Raghunathpur, Laxminiya, Bagharas, Dohatha, Rasiyari and Baur have average values ranging from 0.75 to 0.87, falling in the highest exposure category. All the households of the above-mentioned six villages are affected by the flood (E1), experiencing floods every year for the last five years (E2) because of being located within 1 km of the river stream (E3). Dethua, Ganauni, Bhadhar, Belthari and Kalyan Dih villages are moderately exposed to the flood ranging the normalized values between 0.50 to 0.70. The Harnagr and Ber villages have the least exposure to flood, normalized values are 0.48 and 0.47, respectively, for both villages. The villages in the highest exposure category have a higher normalized value for most of the indicators as compared to the villages in the moderately and least exposed categories.
|
Table 5. The exposure profile of the villages (Source: computed by Authors, 2024). |
|||||||||
|
Indicators Village |
E1 |
E2 |
E3 |
E4 |
E5 |
E6 |
E7 |
E8 |
E* |
|
Raghunathpur |
1 |
1 |
1 |
1 |
0.53 |
0.81 |
0.73 |
0.84 |
0.86 |
|
Laxminiya |
1 |
1 |
1 |
1 |
0.79 |
0.77 |
0.63 |
0.69 |
0.86 |
|
Bagharas |
1 |
1 |
1 |
0.83 |
0.64 |
0.78 |
0.91 |
0.81 |
0.87 |
|
Dohatha |
1 |
1 |
1 |
0.79 |
0.74 |
0.83 |
0.31 |
0.34 |
0.75 |
|
Rasiyari |
1 |
1 |
1 |
0.73 |
0.52 |
0.88 |
0.77 |
0.75 |
0.83 |
|
Baur |
1 |
1 |
1 |
0.61 |
0.81 |
0.74 |
0.95 |
0.61 |
0.84 |
|
Dethua |
0.72 |
1 |
0.53 |
0.57 |
0.43 |
0.7 |
0.37 |
0.89 |
0.65 |
|
Ganauni |
0.67 |
1 |
0.66 |
0.65 |
0.24 |
0.53 |
0.84 |
0.56 |
0.64 |
|
Bhadhar |
0.76 |
1 |
0.66 |
0.68 |
0.33 |
0.72 |
0.78 |
0.61 |
0.69 |
|
Belthari |
0.53 |
1 |
0.33 |
0.64 |
0.47 |
0.12 |
0.66 |
0.43 |
0.52 |
|
Kalyan Dih |
0.33 |
1 |
0.33 |
0.41 |
0.42 |
0.31 |
0.87 |
0.63 |
0.54 |
|
Harnagar |
0.35 |
1 |
0.33 |
0.23 |
0.27 |
0.25 |
0.57 |
0.81 |
0.48 |
|
Ber |
0.48 |
1 |
0.33 |
0.39 |
0.21 |
0.55 |
0.64 |
0.15 |
0.47 |
|
E* = average of all indicators of exposure |
|||||||||
3.2.2. Susceptibility of villages towards floods
This part presents normalized values of susceptible indicators for each village, as shown in Table 6 and Figure 2B. The average normalized values of all susceptible indicators for each village are given in the last column, denoted by S*, while an individual indicator is coded as S. Villages Raghunathpur, Laxminiya, Bagharas, Dohatha, Rasiyari and Baur have the highest susceptibility with average normalized values between 0.61 to 0.79. All the agricultural land in four out of six villages is susceptible to flooding (S9). The village of Raghunathpur has a total of Kutcha houses because of washed out in a previous flood, the most susceptible housing (S8). Total households in Dohatha and Harnagr villages solely depend on agriculture (S7) and allied activities for their livelihood and sustenance. Villages Dethua, Ganauni, Bhadhar and Harnagar are moderately susceptible with normalized values between 0.45 to 0.60. The rest of the villages, including Belthari, Kalyan Dih and Ber, have the least susceptibility to the flood.
|
Table 6. Susceptibility profile of the villages (Source: computed by Authors, 2024). |
||||||||||
|
Indicators Village |
S1 |
S2 |
S3 |
S4 |
S5 |
S6 |
S7 |
S8 |
S9 |
S* |
|
Raghunathpur |
0.61 |
0.81 |
0.47 |
0.89 |
0.23 |
0.67 |
0.91 |
1 |
0.87 |
0.72 |
|
Laxminiya |
0.62 |
0.79 |
0.81 |
0.76 |
0.84 |
0.92 |
0.31 |
0.59 |
1 |
0.74 |
|
Bagharas |
0.70 |
0.76 |
0.63 |
0.74 |
0.98 |
0.55 |
0.91 |
0.84 |
1 |
0.79 |
|
Dohatha |
0.81 |
0.87 |
0.53 |
0.64 |
0.86 |
0.67 |
1 |
0.53 |
0.33 |
0.69 |
|
Rasiyari |
0.43 |
0.61 |
0.54 |
0.81 |
0.92 |
0.34 |
0.23 |
0.57 |
1 |
0.61 |
|
Baur |
0.58 |
0.84 |
0.46 |
0.72 |
0.61 |
0.61 |
0.56 |
0.32 |
1 |
0.63 |
|
Dethua |
0.61 |
0.61 |
0.38 |
0.21 |
0.53 |
0.45 |
0.33 |
0.23 |
1 |
0.48 |
|
Ganauni |
0.31 |
0.86 |
0.29 |
0.52 |
0.62 |
0.87 |
0.45 |
0.61 |
0.55 |
0.56 |
|
Bhadhar |
0.51 |
0.51 |
0.91 |
0.65 |
0.34 |
0.21 |
0.34 |
0.31 |
0.61 |
0.49 |
|
Belthari |
0.79 |
0.31 |
0.37 |
0.42 |
0.49 |
0.34 |
0.47 |
0.29 |
0.51 |
0.44 |
|
Kalyan Dih |
0.49 |
0.34 |
0.55 |
0.36 |
0.41 |
0.43 |
0.29 |
0.26 |
0.55 |
0.41 |
|
Harnagar |
0.57 |
0.26 |
0.61 |
0.24 |
0.32 |
0.51 |
1 |
0.51 |
0.23 |
0.47 |
|
Ber |
0.39 |
0.32 |
0.77 |
0.22 |
0.5 |
0.25 |
0.61 |
0.35 |
0.11 |
0.39 |
|
S* = average of all indicators of susceptibility |
||||||||||
3.2.3. The resilience of villages to the floods
This section discusses the normalized values of all indicators of resilience (R) for each village and the average of all indicators (R*) for a particular village. The respective data is given in Table 7 and shown in Figure 2C. The villages of Raghunathpur, Laxminiya, Bagharas and Rasiyari have the lowest resistance to the floods. The normalized values are less than 0.50. The main cause of such low resilience is their higher exposure to floods. These villages experience floods every year, destroying the supportive infrastructure and other resilience elements. Dohatha, Baur, Ganauni and Bhadhar villages are moderately resilient to the flood with normalized values from 0.50 to 0.70. In moderately resilient villages, Baur has completely considered the effectiveness of DDMA (R1) in flood management. The village of Bhadhar is fully compensated by the government (R8) and the role of community participation (R9) in flood management is very important, solely considered with Ganauni village. The villages Dethua, Belthari, Kalyan Dih, Harnagar and Ber are the highest resilient villages. The average normalised values of all nine indicators of resilience for these highest resilient villages are higher than 0.70. These villages also experience flooding each year, but the floodwater level is quite lower and the period of inundation is comparatively shorter than the moderately resilient and least resilient villages.
|
Table 7. Resilience profile of the villages (Source: computed by Authors, 2024). |
||||||||||
|
Indicators Village |
R1 |
R2 |
R3 |
R4 |
R5 |
R6 |
R7 |
R8 |
R9 |
R* |
|
Raghunathpur |
0.31 |
0.36 |
0.15 |
0.51 |
0.56 |
0.13 |
0.25 |
0.61 |
0.31 |
0.35 |
|
Laxminiya |
0.47 |
0.23 |
0.19 |
0.61 |
0.25 |
0.23 |
0.78 |
0.59 |
0.59 |
0.44 |
|
Bagharas |
0.49 |
0.35 |
0.61 |
0.26 |
0.18 |
0.22 |
0.53 |
0.78 |
0.84 |
0.47 |
|
Dohatha |
0.91 |
0.26 |
0.45 |
0.59 |
0.47 |
0.85 |
0.78 |
0.9 |
0.72 |
0.66 |
|
Rasiyari |
0.14 |
0.52 |
0.36 |
0.44 |
0.52 |
0.22 |
0.39 |
0.78 |
0.88 |
0.47 |
|
Baur |
1 |
0.26 |
0.38 |
0.61 |
0.53 |
0.17 |
0.23 |
0.63 |
0.87 |
0.52 |
|
Dethua |
0.59 |
0.86 |
0.34 |
0.64 |
0.85 |
0.92 |
0.72 |
0.76 |
0.8 |
0.72 |
|
Ganauni |
0.83 |
0.26 |
0.34 |
0.81 |
0.64 |
0.34 |
0.92 |
0.97 |
1 |
0.68 |
|
Bhadhar |
0.23 |
0.56 |
0.61 |
0.29 |
0.81 |
0.51 |
0.56 |
1 |
1 |
0.62 |
|
Belthari |
1 |
0.92 |
0.87 |
0.82 |
0.73 |
0.62 |
0.54 |
0.59 |
0.71 |
0.76 |
|
Kalyan Dih |
0.91 |
0.23 |
0.83 |
0.9 |
0.67 |
0.59 |
0.93 |
1 |
1 |
0.78 |
|
Harnagar |
0.61 |
0.56 |
0.92 |
0.83 |
0.95 |
0.35 |
0.84 |
0.86 |
0.66 |
0.73 |
|
Ber |
0.68 |
0.87 |
0.94 |
0.61 |
0.55 |
0.62 |
0.82 |
0.61 |
0.79 |
0.72 |
|
R* = average of all indicators of resilience |
||||||||||
3.2.4. Overall FVI
The overall FVI is calculated for each village using Equation 2 and presented in Table 8 and Figure 2D. Raghunathpur, Laxminiya, Bagharas, Dohatha, and Rasiyari are the villages most vulnerable to floods. The overall FV values range from 0.78 to 1.23 for these villages. These villages have higher average exposure and susceptibility and a lower average of resilience to floods, leading them to high FV values. Dethua, Ganauni and Bhadhar villages have moderate flood vulnerability with values of between 0.40 to 0.70. Such villages have moderate average exposure, susceptibility and resilience to floods. With overall FV values lower than 0.40, the villages Belthari, Kalyan Dih, Harnagar and Ber are the least vulnerable to floods. These villages are the least exposed and susceptible and have a higher average of resilience.
|
Table 8: Overall flood vulnerability of the villages (Source: computed by Authors, 2024). |
||||
|
Averages of components / Village |
E* |
S* |
R* |
FV |
|
Raghunathpur |
0.86 |
0.72 |
0.35 |
1.23 |
|
Laxminiya |
0.86 |
0.74 |
0.44 |
1.16 |
|
Bagharas |
0.87 |
0.79 |
0.47 |
1.19 |
|
Dohatha |
0.75 |
0.69 |
0.66 |
0.78 |
|
Rasiyari |
0.83 |
0.61 |
0.47 |
0.97 |
|
Baur |
0.84 |
0.63 |
0.52 |
0.95 |
|
Dethua |
0.65 |
0.48 |
0.72 |
0.41 |
|
Ganauni |
0.64 |
0.56 |
0.68 |
0.52 |
|
Bhadhar |
0.69 |
0.49 |
0.62 |
0.56 |
|
Belthari |
0.52 |
0.44 |
0.76 |
0.20 |
|
Kalyan Dih |
0.54 |
0.41 |
0.78 |
0.17 |
|
Harnagar |
0.48 |
0.47 |
0.73 |
0.22 |
|
Ber |
0.47 |
0.39 |
0.72 |
0.14 |
|
OAV = overall vulnerability |
||||
4. DISCUSSION
The findings of the study indicate a significant variation in flood vulnerability across different villages, determined based on their proximity to the Kamala-Balan River, socio-economic conditions and resilience mechanisms. Villages such as Raghunathpur, Laxminiya and Bagharas exhibit the highest flood vulnerability due to their closer proximity to the river, prolonged inundation period and poor infrastructure. In contrast, villages like Kalyan Dih and Ber demonstrate comparatively lower vulnerability, which can be attributed to better resilience indicators, including improved housing conditions and higher awareness levels. These findings have aligned with the previous studies of Kumar & Chyrmang (2022) and Kumar & Pradhan (2024), who also reported that flood vulnerability in Bihar is primarily driven by socio-economic disparities, inadequate infrastructure and ineffective flood management strategies. However, the present study expands on these findings by incorporating a spatially explicit vulnerability assessment using GIS tools, which enhances the precision of vulnerability classification.
The study also corroborates the work of Erena & Worku (2019), who emphasized the significance of exposure, susceptibility and resilience as key determinants of flood vulnerability assessment. Similarly, in their conclusions, this study found that higher exposure combined with higher susceptibility significantly increases flood vulnerability. Additionally, this study supports the argument presented by Cvetković et al. (2018) that males predominantly control disaster preparedness and adaptation strategies, leading to gender-based vulnerabilities. The current study also strengthens the assertion made by Naz & Saqib (2021) that rural women farmers remain more vulnerable due to limited access to disaster preparedness information and low levels of education.
In contrast to previous studies by Jha & Gundimeda (2019) that focused primarily on a broad regional assessment, this study provides a micro-level vulnerability analysis, making it more relevant for localized flood management planning. The use of IDW interpolation to categorize villages into different vulnerability zones adds a methodological advancement that enables a more data-driven approach to flood mitigation planning. This differs from the prior assessments, such as those by Singh et al. (2014) which relied heavily on district-level statistical models that lacked spatial precision. The study also offers actionable recommendations for flood mitigation strategies in highly vulnerable villages. The strategic modelling approach proposed in this study - integrating structural measures (embankment reinforcement, drainage improvements) with non-structural measures (community-based training, financial literacy programmes) agrees with the flood risk reduction strategies advocated by Matheswaran et al. (2019). However, the study diverges from the traditional flood mitigation models by emphasizing the role of community participation in maintaining embankments and early warning systems, which has been underexplored in previous studies.
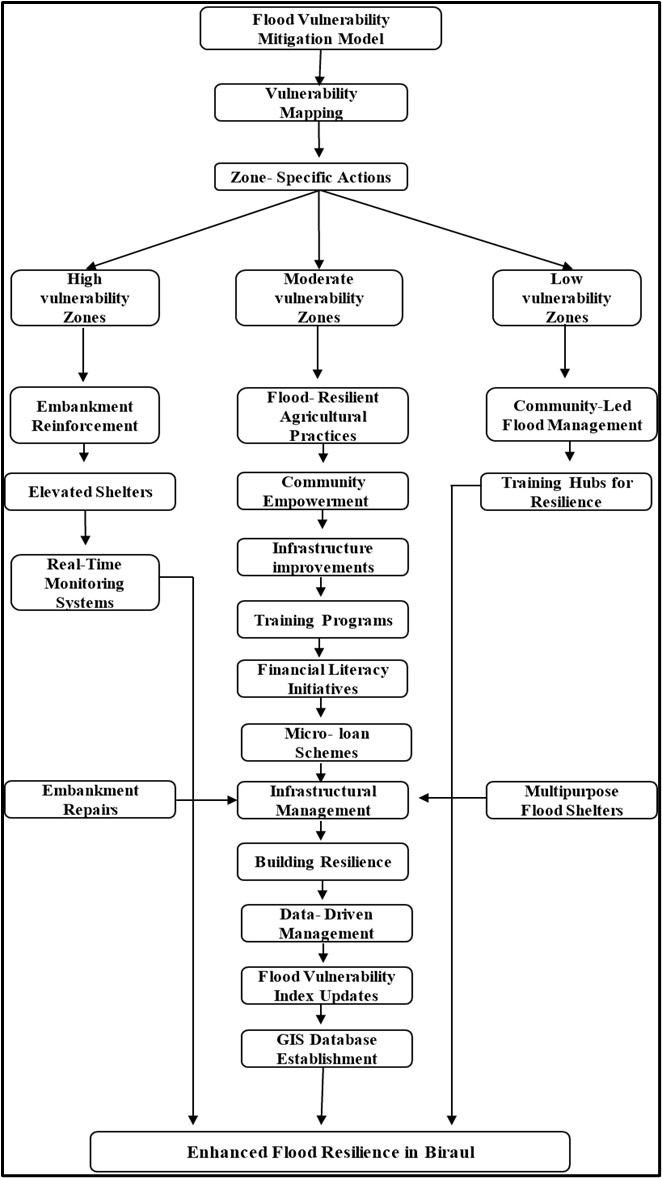
5. STRATEGIC MODELLING FOR FLOOD VULNERABILITY MITIGATION
This model focuses on precise, actionable strategies tailored specifically for the Biraul sub-division of Darbhanga District, Bihar, using findings from the study. By integrating GIS-based tools, community-focused initiatives, and infrastructure upgrades, this plan aims to reduce flood vulnerability effectively.
Raghunathpur, Laxminiya, Bagharas, Dohatha, and Rasiyari are the most flood-vulnerable villages in Biraul subdivision. These villages need focused and monitored interventions. This zone immediately requires embankment reinforcement to prevent breaches and building elevated shelters for the displaced population. Real-time monitoring systems for floods are essential in these areas to provide early warnings, which enable the timely evacuation. The regular embankment repairs are necessary to maintain the integrity of flood protection. Dethua, Ganauni and Bhadhar villages have moderate flood vulnerability. In these villages, flood occurs intermittently and still pose a significant threat. This zone needs a balanced approach that combines infrastructure improvement with community participation. Implementation of flood-resilient agricultural practices leads to livelihood sustainability and ensures food security during and after flood events. The villages Belthari, Kalyan Dih, Harnagar and Ber are the least vulnerable to floods and can contribute significantly by improving community-led flood mitigation strategies. Enhancing community resilience by implementing village-level training initiatives and instructions on preparedness and adaptation techniques to manage floods effectively. The infrastructure development, like reinforcement of embankments along the Kamala-Balan River and establishment of multipurpose shelters, is crucial for the preservation of life and natural resources in the affected area. economic initiatives such as microloan schemes and insurance programs offer a financial safeguard to the affected households.
Ultimately, efficient flood management necessitates ongoing data-informed monitoring and strategic planning. This entails the continual revision of an FVI that monitors elements like as exposure, susceptibility, and resistance at the village level. The creation of a centralized GIS database enables local authorities to monitor flood trends in real time and devise strategic measures appropriately. A district-level control center can enhance the coordination of these initiatives, ensuring that prompt decisions are taken during flood occurrences based on precise data analysis.
6. CONCLUSION
This study successfully developed a composite FVI using 67 socio-economic, infrastructure, and environmental indicators, integrated through IDW spatial interpolation. The FVI classified villages in the Biraul sub-division into high, moderate, and low vulnerability zones. Villages like Raghunathpur, Laxminiya and Bagharas situated near Kamla Balan River, were most at risk due to poor housing, low preparedness, and environmental exposure, while Kalyan Dih and Ber showed greater resilience, with better infrastructure, awareness, and adaptive capacity.
The study holds significant policy implications for flood risk management in Bihar. First, structural mitigation measures such as embankment reinforcement, improved drainage systems and elevated shelters should be prioritized in highly vulnerable villages. Second, non-structural interventions including capacity building programmes, financial literacy initiatives and gender inclusive disaster preparedness strategies should be promoted to enhance community resilience. The study underscores the necessity of strengthening institutional coordination between disaster management authorities and local governance bodies to facilitate timely interventions. Additionally, integrating real-time remote sensing data with GIS can enhance flood forecasting and early warning systems, allowing for proactive disaster response.
From a broader perspective, this research contributed to existing knowledge by advancing a micro-level flood vulnerability assessment framework that integrates spatial analysis with socio-economic determinants and provides a more precise understanding of flood risk at the village level, enabling targeted policy interventions. Furthermore, the study highlights the role of community participation in disaster management, advocating for localized resilience strategies that empower vulnerable groups, particularly women and small-scale farmers. The study offers actionable insight that can help policymakers, local authorities and NGOs in designing effective flood mitigation strategies. By identifying critical vulnerability hotspots, resources can be allocated efficiently to safeguard lives, livelihoods and infrastructure. Moreover, promoting community-based disaster preparedness can foster a culture of resilience, reducing dependency on external aid during flood events.
REFERENCES
- Ahmad, D., & Afzal, M., 2022. Flood hazards and agricultural production risks management practices in flood-prone areas of Punjab, Pakistan. Environmental Science and Pollution Research, 29(14), 20768–20783, https://doi.org/10.1007/ s11356-021-17182-2.
- Ahmad, D., & Afzal, M., 2024. Climate change flood risks and post-flood agricultural and non-agricultural economic losses in flood-prone Bait households Muzaffargarh district of Punjab, Pakistan. In Environment, Development and Sustainability (Issue 0123456789). Springer Netherlands, https://doi.org/10.1007/s10668-024-04674-7.
- 2022 Global natural disaster assessment report, 2023. Issue October 2023.
- Almasi, A., Jalalian, A., & Toomanian, N., 2014. Using OK and IDW Methods for Prediction the Spatial Variability of A Horizon Depth and OM in Soils of Shahrekord, Iran. Journal of Environment and Earth Science, 4(16), 17–28.
- Aydin, M.C., & Sevgi Birincioğlu, E., 2022. Flood risk analysis using gis-based analytical hierarchy process: a case study of Bitlis Province. Applied Water Science, 12(6), 1–10, https://doi.org/10.1007/s13201-022-01655-x.
- Bali, R., & Pathak, S., 2021. Flood Hazard Vulnerability Mapping for Darbhanga District of Bihar Using Sar Data : Effort Towards Effective Disaster Management. International Journal of Social Science and Economic Research, 6(12), 4673–4685, https://doi.org/10.46609/IJSSER.2021.v06i12.013.
- Balica, S.F., Douben, N., & Wright, N.G., 2009. Flood vulnerability indices at varying spatial scales. Water Science and Technology, 60(10), 2571–2580, https://doi.org/10.2166/wst.2009.183.
- Bartier, P.M., & Keller, C.P., 1996. Multivariate interpolation to incorporate thematic surface data using inverse distance weighting (IDW). Computers and Geosciences, 22(7), 795–799, https://doi.org/10.1016/0098-3004(96)00021-0.
- Bhatt, C.M., Srinivasa Rao, G., Manjushree, P., & Bhanumurthy, V., 2010. Space based disaster management of 2008 Kosi floods, North Bihar, India. Journal of the Indian Society of Remote Sensing, 38(1), 99–108, https://doi.org/10.1007/s12524-010-0015-9.
- Chau, V.N., Holland, J., Cassells, S., & Tuohy, M., 2013. Using GIS to map impacts upon agriculture from extreme floods in Vietnam. Applied Geography, 41(July), 65–74, https://doi.org/10.1016/ j.apgeog.2013.03.014.
- Cvetković, V.M., Roder, G., Öcal, A., Tarolli, P., & Dragićević, S., 2018. The role of gender in preparedness and response behaviors towards flood risk in Serbia. International Journal of Environmental Research and Public Health, 15(12), https://doi.org/10.3390/ijerph15122761.
- Dottori, F., Martina, M.L.V., & Figueiredo, R., 2018. A methodology for flood susceptibility and vulnerability analysis in complex flood scenarios. Journal of Flood Risk Management, 11, S632–S645, https://doi.org/10.1111/jfr3.12234.
- Erena, S.H., & Worku, H., 2019. Urban flood vulnerability assessments: the case of Dire Dawa city, Ethiopia. Natural Hazards, 97(2), 495–516, https://doi.org/10.1007/s11069-019-03654-9.
- Harman, B.I., Koseoglu, H., & Yigit, C.O., 2016. Performance evaluation of IDW, Kriging and multiquadric interpolation methods in producing noise mapping: A case study at the city of Isparta, Turkey. Applied Acoustics, 112, 147–157, https://doi.org/10.1016/j.apacoust.2016.05.024.
- Hoque, M., 2023. The impact of floods on the livelihood of rural women farmers and their adaptation strategies: insights from Bangladesh. Natural Hazards, 119(3), 1991–2009, https://doi.org/ 10.1007/s11069-023-06207-3.
- Ikechukwu, M.N., Ebinne, E., Idorenyin, U., & Raphael, N.I., 2017. Accuracy Assessment and Comparative Analysis of IDW, Spline and Kriging in Spatial Interpolation of Landform (Topography): An Experimental Study. Journal of Geographic Information System, 09(03), 354–371, https://doi.org/10.4236/jgis.2017.93022.
- Jha, R.K., & Gundimeda, H., 2019. An integrated assessment of vulnerability to floods using composite index – A district level analysis for Bihar, India. International Journal of Disaster Risk Reduction, 35(October 2018), https://doi.org/10.1016/ j.ijdrr.2019.101074.
- Kale, V.S., 2008. Himalayan catastrophe that engulfed north Bihar. Journal of the Geological Society of India, 72(6), 713–719.
- Kumar, G.D., & Pradhan, K.C., 2024. Assessing the district-level flood vulnerability in Bihar, eastern India: an integrated socioeconomic and environmental approach. Environmental Monitoring and Assessment, 196(9), https://doi.org/10.1007/ s10661-024-12952-0.
- Kumar, R., & Chyrmang, R., 2022. A composite flood vulnerability index: District level analysis for Bihar. BJPA, 19(2), 139–154.
- Lerche, J., 1998. Agricultural Labourers , the Transition in Uttar Agrarian. Economic and Political Weekly, 33(13), A29–A35.
- Madhuri, Tewari, H.R., & Bhowmick, P.K., 2015. Livelihood vulnerability index analysis: An approach to study vulnerability in the context of Bihar. Jamba: Journal of Disaster Risk Studies, 6(1), 1–13, https://doi.org/10.4102/jamba.v6i1.127.
- Madhuri, Tewari, H.R., & Bhowmick, P. K., 2016. Living with Flood: A Livelihood Resilience Approach of Rural People in Bihar, India. Journal of Risk Analysis and Crisis Response, 6(2), 48, https://doi.org/10.2991/jrarc.2016.6.2.1.
- Matheswaran, K., Alahacoon, N., Pandey, R., & Amarnath, G., 2019. Flood risk assessment in South Asia to prioritize flood index insurance applications in Bihar, India. Geomatics, Natural Hazards and Risk, 10(1), 26–48, https://doi.org/10.1080/19475705.2018.1500495.
- Mukta, A.Y., Haque, M.E., Islam, A.R.M.T., Fattah, M.A., Gustave, W., Almohamad, H., Al Dughairi, A.A., Al-Mutiry, M., & Ghassan Abdo, H., 2022. Impact of Canal Encroachment on Flood and Economic Vulnerability in Northern Bangladesh. Sustainability (Switzerland), 14(14), https://doi.org/ 10.3390/su14148341.
- Nasiri, H., Yusof, M.J.M., Ali, T.A.M., & Hussein, M.K.B., 2019. District flood vulnerability index: urban decision-making tool. International Journal of Environmental Science and Technology, 16(5), 2249–2258, https://doi.org/10.1007/s13762-018-1797-5.
- Nayak, S., 2023. Report on aquifer mapping and management plan in Darbhanga district, Bihar (AAP 2022-23). Issue April.
- Naz, F., & Saqib, S.E., 2021. Gender-based differences in flood vulnerability among men and women in the char farming households of Bangladesh. Natural Hazards, 106(1), 655–677, https://doi.org/10.1007/ s11069-020-04482-y.
- Nguyen, C.T., & Van Nguyen, B., 2019. Application of flood vulnerability index in flood vulnerability assessment: a case study in Mai Hoa Commune, Tuyen Hoa District, Quang Binh Province. Sustainable Water Resources Management, 5(4), 1917–1927, https://doi.org/10.1007/s40899-019-00337-y.
- Okyere, C.Y., Yacouba, Y., & Gilgenbach, D., 2013. Theoretical and Empirical Researches in Urban Management of floods in Accra: An integration of hydrological, economic and political perspectives. Theoretical and Empirical Researches in Urban Management, 8(2), 45–79.
- Preparation of State Disaster Plan, 2007. Ndma. Issue July.
- Qiao, P., Li, P., Cheng, Y., Wei, W., Yang, S., Lei, M., & Chen, T., 2019. Comparison of common spatial interpolation methods for analyzing pollutant spatial distributions at contaminated sites. Environmental Geochemistry and Health, 41(6), 2709–2730, https://doi.org/10.1007/s10653-019-00328-0.
- Rozalis, S., Morin, E., Yair, Y., & Price, C., 2010. Flash flood prediction using an uncalibrated hydrological model and radar rainfall data in a Mediterranean watershed under changing hydrological conditions. Journal of Hydrology, 394(1–2), 245–255, https://doi.org/10.1016/j.jhydrol.2010.03.021.
- Sahani, R.K., Badiger, S., Samrat, A., & Krishnan, S., 2023. Flood frequency and flood intensity changes in the post embankment period in the Kosi sub-basin India: Impact of location, caste, and class on the flood vulnerability of the marginal communities. Frontiers in Water, 5, https://doi.org/10.3389/ frwa.2023.1017945.
- Shah, M., 2013. Water: Towards a paradigm shift in the twelfth plan. Economic and Political Weekly, 48(3), 40–52.
- Shrestha, R.K., Ahlers, R., Bakker, M., & Gupta, J., 2010. Institutional dysfunction and challenges in flood control: A case study of the Kosi flood 2008. Economic and Political Weekly, 45(2), 45–53.
- Singh, S.R., Eghdami, M.R., & Singh, S., 2014. The Concept of Social Vulnerability : A Review from Disasters Perspectives. International Journal of Interdisciplinary and Multidisciplinary Studies, 1(6), 71–82.
- Singh, C.S., Anima, K., & Kumar, P.B., 2014. Environmental Challenge due to Climate Change in Bihar, Developing State of India. Journal of Natural Sciences Research, 4(13), 21–28, https://core.ac.uk/download/pdf/234654799.pdf.
- Singh, K.M., Prasad, M.C., & Prasad, G., 2010. Semi quantitative forecasts for baghmati/adhwara group of rivers/kamala balan catchments by synoptic analogue technique. Mausam, 61(3), 337–348, https://doi.org/10.54302/mausam.v61i3.836.
- Singh, N.P., 2021. The Struggle Between Life and Death: A Case Study of Panapur Flood, District Saran, Bihar, India. Journal of Marine Science Research and Oceanography, 4(3), 238–242, https://doi.org/10.33140/jmsro.04.03.02.
- Singh, V.K., & Singh, S., 2008. Strategies for Flood Mitigation in Bihar An Assessment of Its Effects & Future Orientation. Pragyaan: JOM, 6(2), 71–84.
- Tripathi, G., Pandey, A.C., Parida, B.R., & Kumar, A., 2020. Flood Inundation Mapping and Impact Assessment Using Multi-Temporal Optical and SAR Satellite Data: a Case Study of 2017 Flood in Darbhanga District, Bihar, India. Water Resources Management, 34(6), 1871–1892, https://doi.org/ 10.1007/s11269-020-02534-3.
- Turay, B., 2022. Flood hazard management in a multiple hazard context: a systematic review of flood hazard management during the COVID-19 pandemic in Africa. Discover Water, 2(1), https://doi.org/10.1007/s43832-022-00014-w.
- Watanabe, T., Cullmann, J., Pathak, C.S., Turunen, M., Emami, K., Ghinassi, G., & Siddiqi, Y., 2018. Management of Climatic Extremes with Focus on Floods and Droughts in Agriculture. Irrigation and Drainage, 67(1), 29–42, https://doi.org/ 10.1002/ird.2204.