1. INTRODUCTION
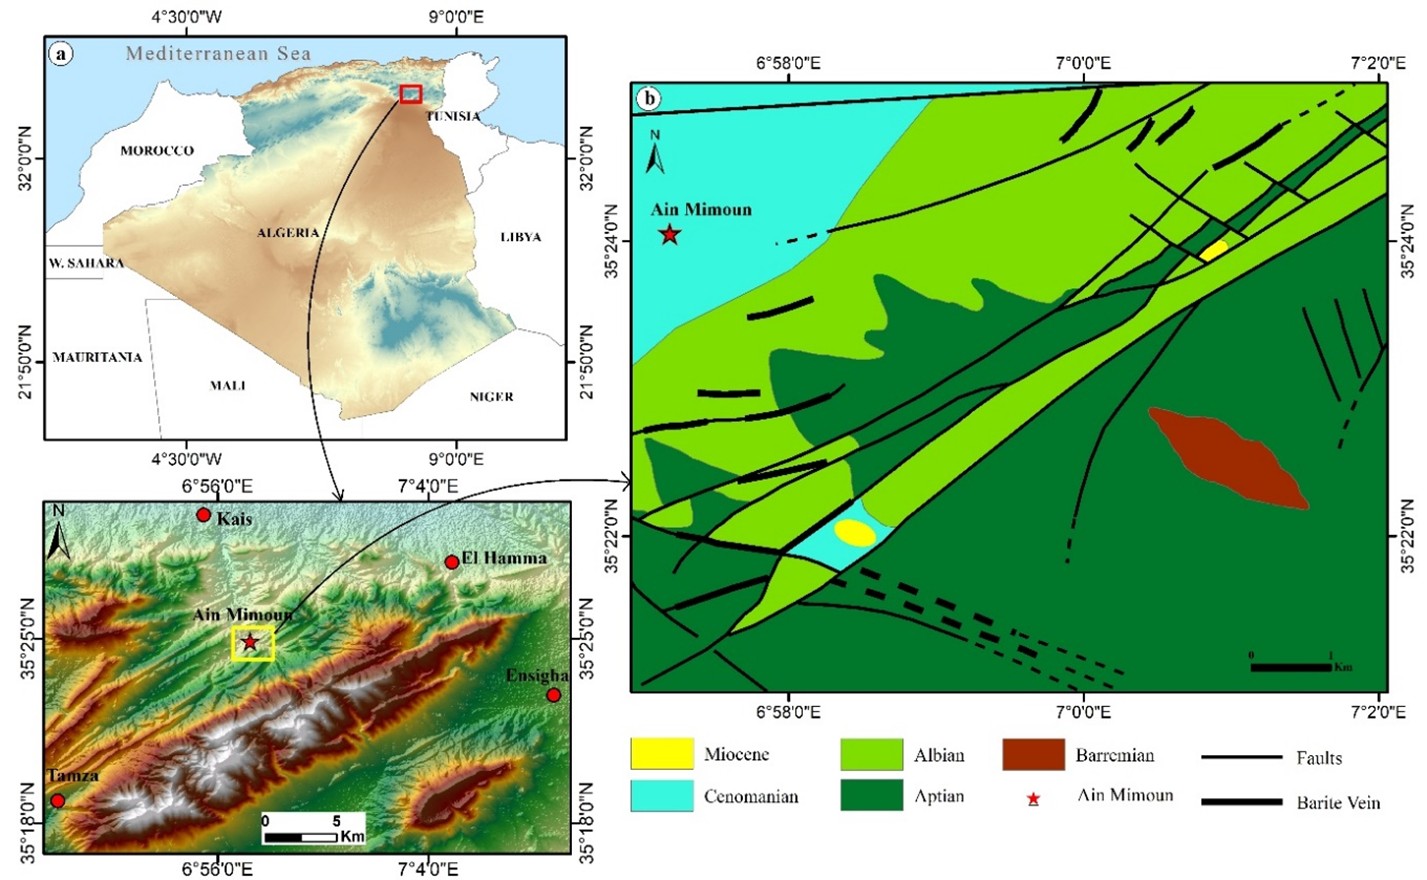
Baryte is a non-metallic substance belonging to a sulphate group with the formula BaSO₄. It is often of hydrothermal origin and presents numerous varieties with traces of Sr, Ca, Mg, and Pb. It is a mineral present in various geological formations, crystallising in the orthorhombic system to form globular, fibrous, or lamellar concretions that are white more or less translucent. It is used as a weighting agent in drilling muds as well as in other industrial sectors due to its particular properties: high density (d = 4.48 at 26°C), high whiteness, low abrasiveness, chemical neutrality, and high melting point (1580°C), (Deniz & Güler, 2018). In 2019, global baryte production reached 8.87 million tonnes (Mt), representing a $1.4 billion market that is expected to reach $2.4 billion by 2027 due to increased hydrocarbon drilling activity and investment by oil companies in deep-sea exploration (USGS, 2019). Algeria's baryte mining potential amounts to 6.7 Mt, of which nearly 1.6 Mt is in the industrial category. Deposits of economic interest are confined to the north of the country: Ain Mimoun (Khenchela), Boukaïd (Tissemsilt), Mellal (Tlemcen), and Koudiat Safia (Medea). Current production potential is represented by the Boukaïd and Ain Mimoun mines, which supply 50,000 tonnes of baryte that are used mainly in the oil drilling sector (Batouche, 2021). The Ain Mimoun "Mizab" baryte deposit is located on the northern flank of the Khenchela anticline, about 20 km west of the town of Khenchela, 15 km southwest of El Hamma, and 20 km north of the Tamza area (Zedam, 2012), (Figure 1-a). It lies within the coordinates 6°57‘, 7°02’ east (longitude) and 35°21‘, 35°25’ north (latitude). The study area is limited to the north by the R'mila and Garaet Tarf plains; to the east by the town of Khenchela and the Djebels Chettaia, Knif, and Krouma; to the south by the Es Sbikha depression and Djebel Djahfa; and to the west and southwest by the Djebels Chélia, Faraoun, and Chentgouma (Benabbas, 2006). This study aims to establish a petro-mineralogical, granulometric, and physico-chemical characterisation of the raw material while highlighting the properties of the associated mineralogical assemblage, particle size distribution, and the chemical evolution of the various constituent elements. This approach may also improve the choice of separation processes.
2. GEOLOGICAL SETTING
The Khenchela anticline is a structural entity belonging to the last link of the Aurès chain towards the east and forming part of the northeastern Saharan Atlas. This chain is crossed by large regular folds orientated NE–SW, which were inherited from the major Atlasic tightening tectonic phase in the late Lutetian through the Bartonian. The anticline forms part of the Auresian basin, which is located between the relatively stable Saharan platform to the south and the mobile Tellian domain to the north (Laffitte, 1939; Bellion et al., 1973; Bureau, 1986; Perthuisot et al., 1988; Guiraud, 1990; Piqué et al., 2002; Khomsi et al., 2006). This position is inferred from the presence of various stratified, fauna-rich detrital and carbonate facies. During the upper Cretaceous the basin underwent progressive deepening and is now interspersed with extensive NW–SE trending phases (Doglioni et al., 1999; Verges & Sabat, 1999; Frizon de Lamotte et al., 2006; Dhahri & Boukadi, 2010). Dolomites and dolomitic limestones developed in the Lias, while marls and marl-limestones appeared with sandstone intercalations during the Dogger.
The spatial distribution of Triassic and Jurassic facies was essentially controlled by eustatism, sedimentary supply, and tectonics. The Saharan paleo-reliefs are the source of the immense quantity of clay silico-clastic material deposited during the active erosion phase (Guiraud, 1990; Herkat, 1992). The transgression of the Lower Aptian deposited carbonate sedimentation, while the subsequent regression favoured the development of reef formations. The transgressive phase of the Middle Albian reached its apogee at the end of the Cenomanian and the beginning of the Turonian, hence the establishment of typically carbonate sedimentation. The sea retreated from the Senonian under pelagic influence and the reactivation of epi-orogenic movements (Vila, 1980; Yahiaoui, 1990). In the Paleogene, the major tightening phase caused the shortening of syn-sedimentary structures and upper Cretaceous deposits. Finally, the last Plio-Quaternary compressive phase led to the exaggeration of Eocene foldings (Kazi-Tani, 1986; Pique et al., 2002; Khomsi et al., 2006). In short, the large quantity of sediment accumulated in the Aurès from the Triassic through the Pliocene is due to the proximity of the African continent, where the action of erosion over large areas fed this large amount of sedimentation.
In the Khenchela anticline, the Cretaceous geological formations are represented by concordant and monotonous series, in which the predominant detrital facies in the lower Cretaceous were progressively replaced by carbonate lithologies in the upper Cretaceous (Laffitte, 1939; Camoin et al., 1990). The oldest sediments are represented by Triassic evaporitic lithologies (Lessard, 1955; Vila, 1977; Perthuisot, 1994; Jallouli et al., 2005; Zedam, 2012; Hezzi, 2014). This anticline shows tectonic structures consisting of inclined mega-blocks bounded by vertical faults running NNW–SSE to NW–SE (Vila, 1977; Benabbas, 2006).
The Cretaceous formations of Ain Mimoun are represented by various lithologies, ranging from Barremian to Cenomanian, and are capped by an unconformable and transgressive Miocene (Figure 1-b). The Barremian is characterised by azoic sandstones with millimetre-sized grains, massive structures, and fine pores. The Aptian begins with grey sandy marls with biomicritic intercalations before becoming sub-reefal, where it consists of orbitoline limestones and massive dolomites. Its upper limit is marked by a marly level corresponding to the base of the Clansayesian (Laffitte, 1939; Lessard, 1955; Vila, 1977; Guiraud, 1990; Zedam et al., 2007). The Albian is comprised of fine sandstones with carbonate cement, followed by grey marls, ferruginous sandstones, and silty clays.
The whole is topped by massive bluish-grey limestones. The Cenomanian begins with grey Rotalipores marls topped by black marls with whitish micrites. It does not contain the slightest amount of sandstone, reflecting a radical change in the depositional environment (Laffitte, 1939; Vila, 1977; Yahiaoui, 1990; Guiraud, 1990). The Miocene is represented by unconformable continental Aquitano-Burdigalian formations. These are reddish silty clays, puddings with large and rounded limestone elements, and quartz sandstone (Camoin et al., 1990).
These formations are sterile, they don’t contain the slightest hint of mineralisation, which proves that the latter is pre-Miocene (Zedam, 2012; Zedam et al., 2022). It should be noted that the barytic veins of the Ain Mimoun deposit are confined to geological formations of Aptian-Albian age, with various lithological natures (limestones, dolomitic limestones, dolomites, sandstones, marly limestones and marls).
3. MINERALOGICAL ANALYSIS
3.1. Overview of the Mizab Baryte Vein System
The Mizab baryte deposit is a complex vein field covering an area of around 250 km2 in the locality of Ain Mimoun. It was discovered during revision work on the copper index, as shown by the Société Nationale de la Recherche Minière. There are twelve (12) main baryte veins. They have surface lengths of 100 to 1450 m, depths of 40 to 100 m, average true thickness of 1 to 2.3 m, and BaSO4 contents ranging from 77 to 93.53 % (Zedam, 1998). This field reveals rich and diverse mineralogical composition: gangue minerals (baryte, quartz, dolomite, calcite), metallic minerals (mineral phases of tennantite series, chalcopyrite, galena, sphalerite), and supergene alteration minerals (malachite, azurite, iron oxides and hydroxides) (Zedam, 1998; Haddouche et al., 2010; Abdellaoui et al., 2019; Ysbaa et al., 2021; Zedam et al., 2022).
The baryte is confined exclusively to fractures and tectonic faults running NE–SW, E–W, and NW–SE, demonstrating structural control. It is associated with a varied mineralogical assemblage (sulphides, sulphosalts, quartz, carbonates, iron oxides, hydroxides). Its vein mineralisation is multi-phased, occupying voids and open space-filling, and is secant to the stratification, which gives it an epigenetic hydrothermal character of pre-Miocene age, probably related to the extensive fault system resulting from Mesozoic-Cenozoic tectonics in the Saharan Atlas (Piqué et al. 2002). It is important to consider the role of tectonics and the impact of the epigenetic phenomena of dolomitisation, ferrification, and silicification in order to understand and interpret the genetic model adopted at this deposit (Popov, 1968; Jébrak, 1992; Haddouche et al., 2010; Zedam, 1998; Zedam et al., 2022).
3.2. Dolomitisation
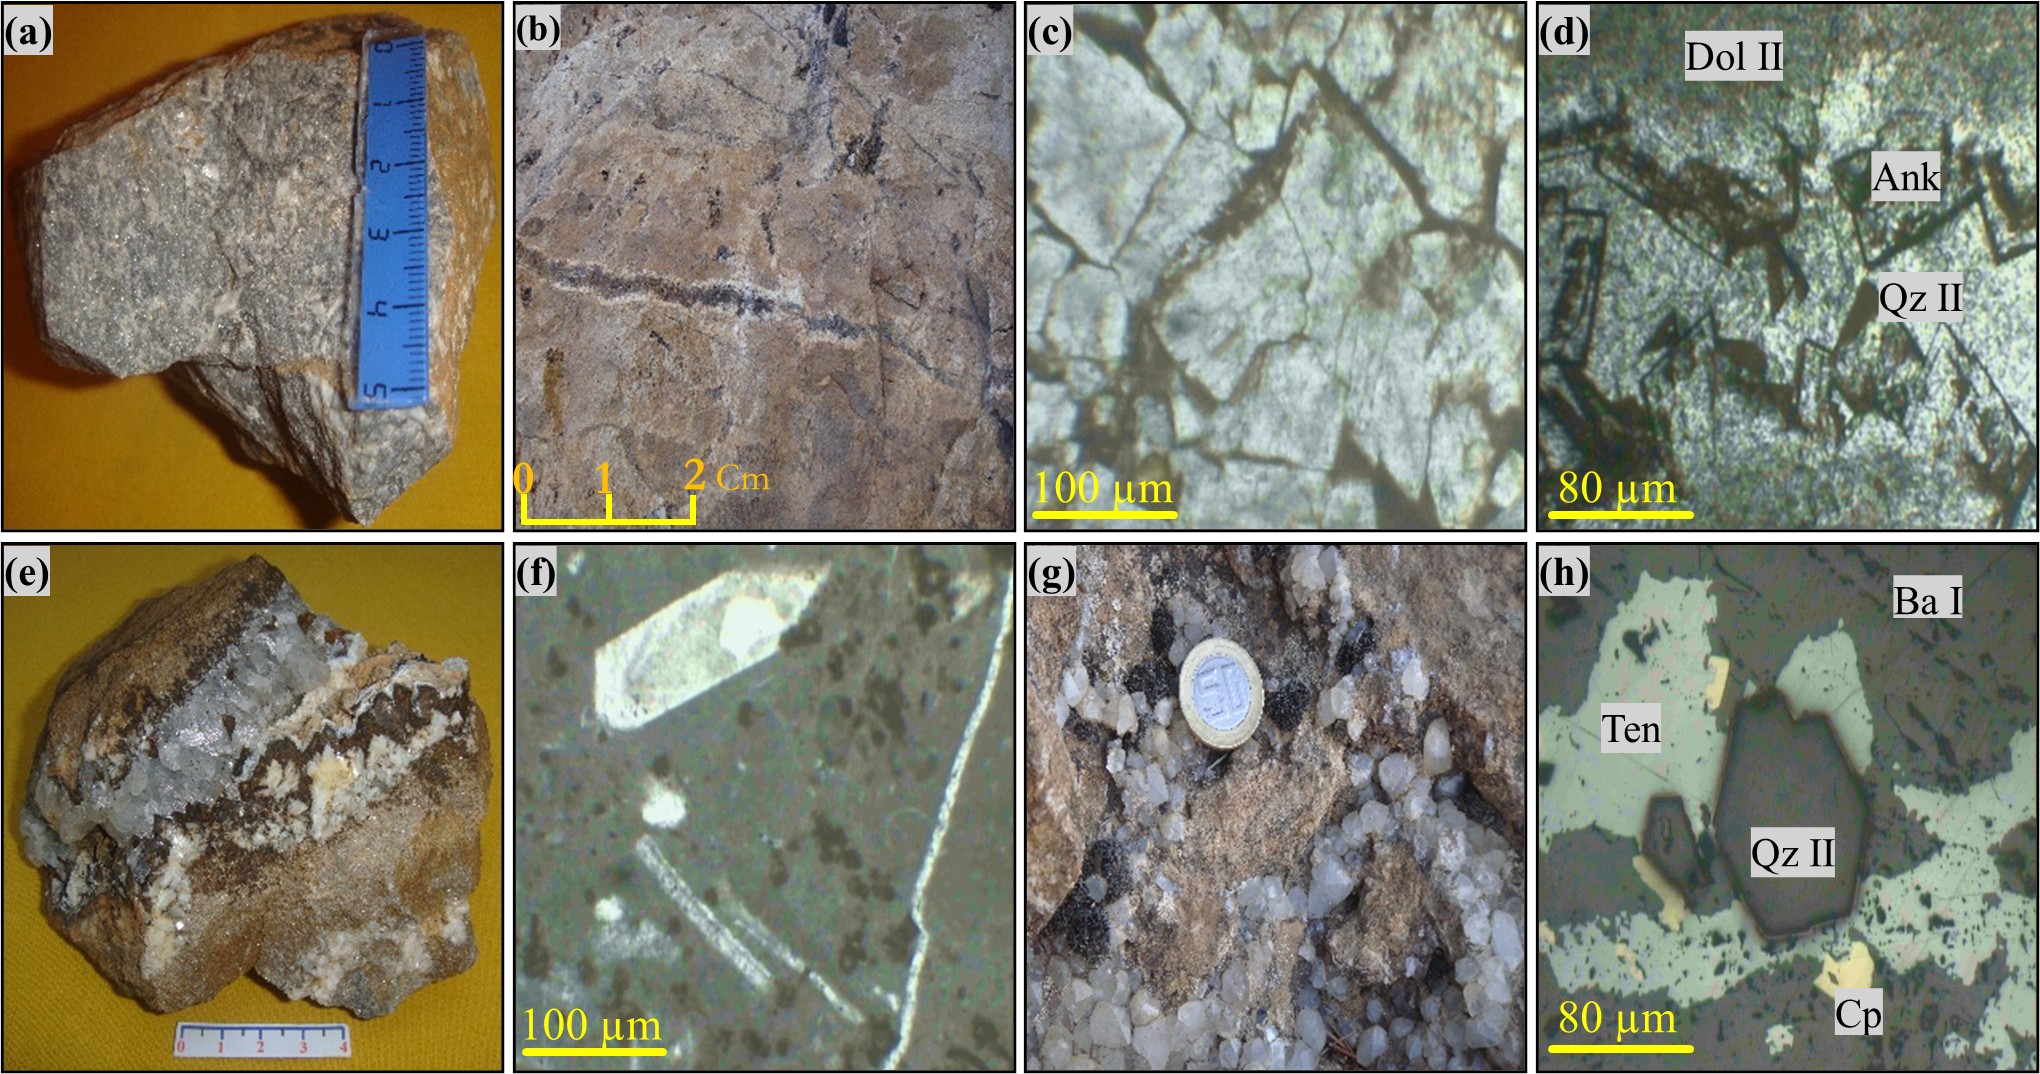
The process of dolomitisation in the Aptian limestones is manifest in irregular, multi-metre aureoles, especially in the contact zones between the baryte veins and the host rock. The cavities and dissolution pores of the dolomitic facies distributed around the microfractures and styloliths are invested with crystals of saddle dolomite with pearly ends of ankerite and iron oxides (Figure 2-b). Sometimes these crystals become more regular, automorphic-to-sub-automorphic, and with a zoned core due to the ferruginisation effect, as shown by clear borders around the edges (Figure 2-c). They reveal a druzy arrangement with points directed towards the centres of the voids that they partially or completely cover (birdeyes, sheet cracks), (Friedman, 1965; M’Rabet, 1981; Gregg & Sibley, 1984), (Figure 2-d). The same cavities also show automorphic quartz crystals in association with ankerite and baryte crystals arranged in palisades and radiating fibres (Figure 2-e). Dolomite may also be associated with late metallic mineralisation (sulphides and sulphosalts).
3.3. Silicification
Silicification is expressed by automorphic, prismatic, and sometimes authigenic quartz grains, which are arranged in voids and dissolution pores on the spurs of barytic veins and which vary in size from 2 to 10 mm (Figure 2-f). The phenomenon also occurs as a xenomorphic fine grains (1 to 6 mm in size), agglutinated in the microcracks and contact zones of the veins within the host rock (Qtz II, Figure 2-g). Both types of grain remain associated with baryte, ankerite, metallic minerals, iron oxides, and, rarely, calcite (Figure 2-h). Silicification is general, clearly late, and omnipresent in the host rock.
3.4. Barytisation
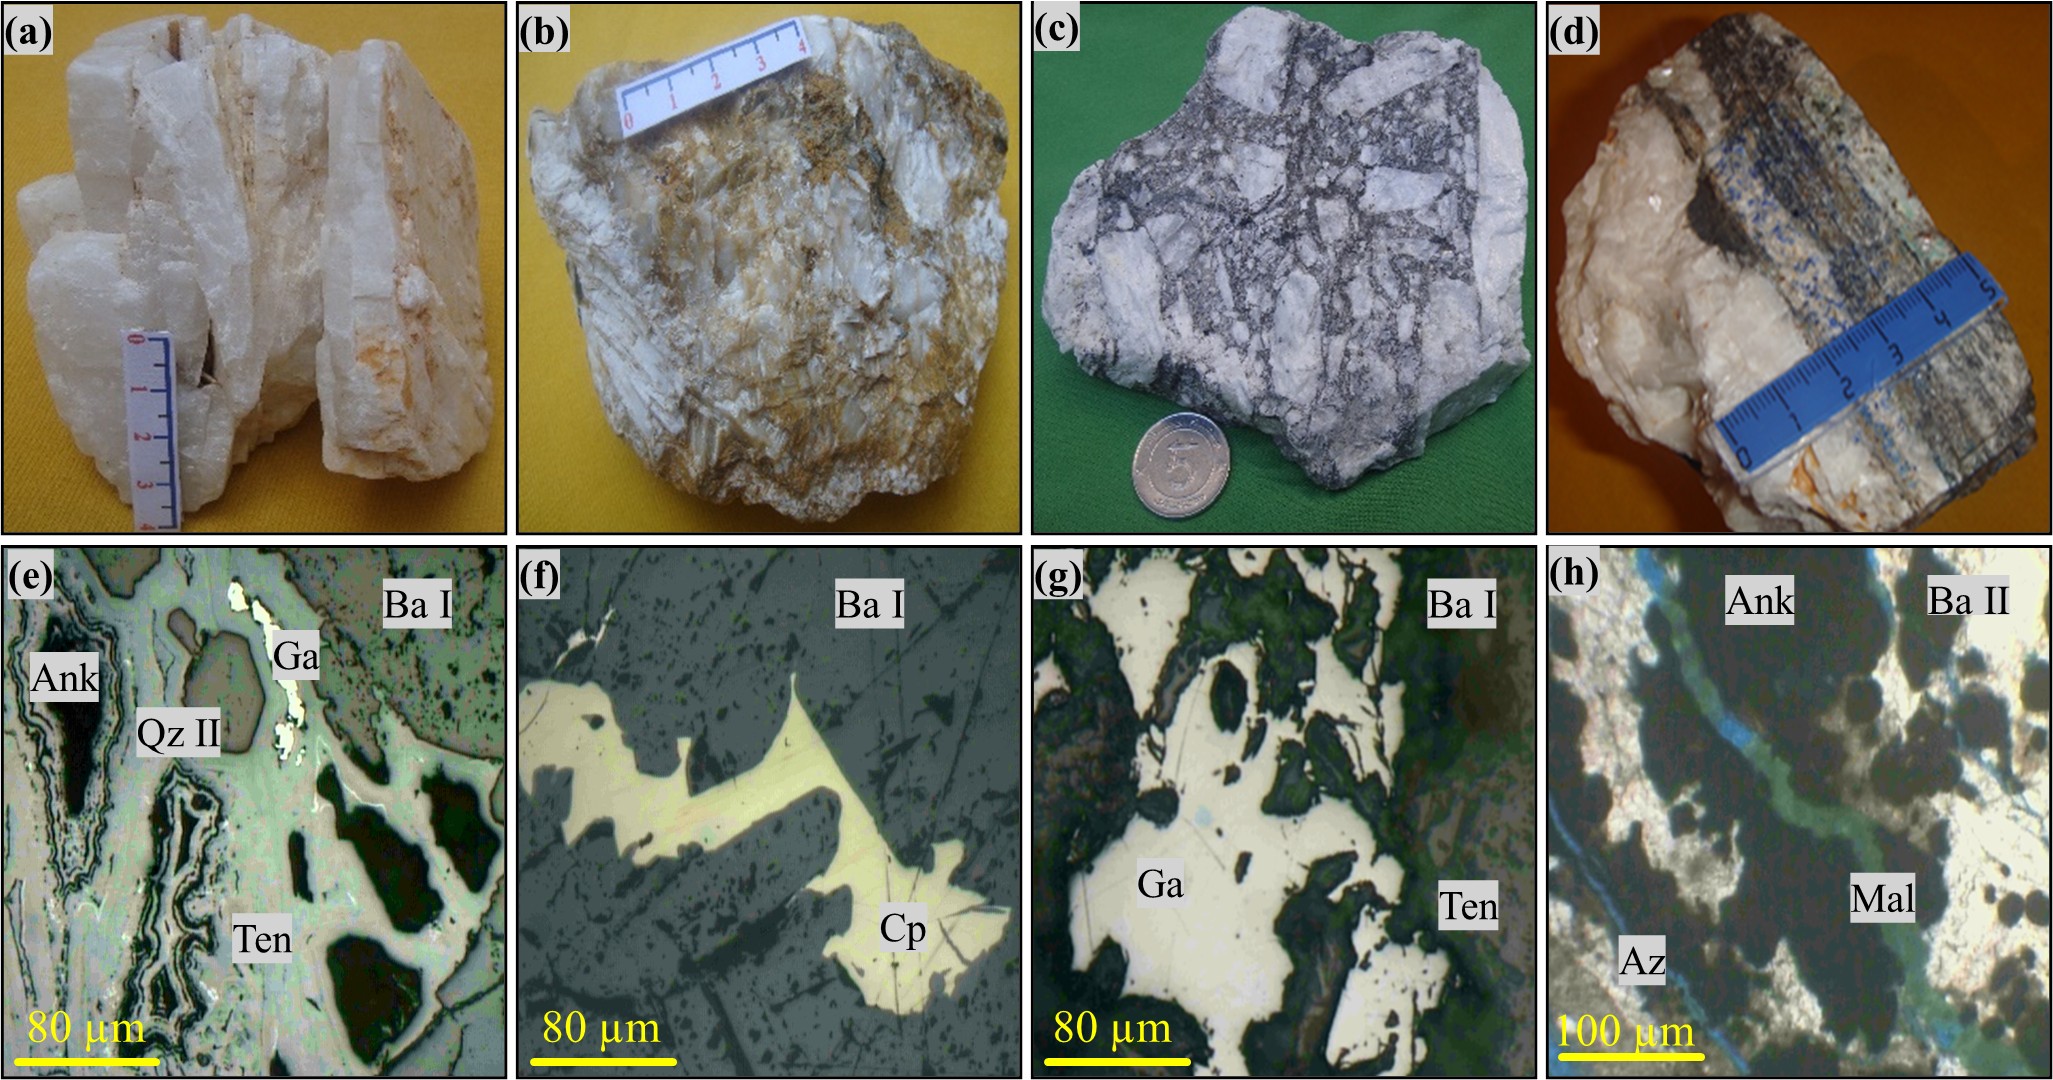
Baryte occurs as infill in fractures that are clearly oblique and unconform to the rock stratification, giving it an undeniably epigenetic hydrothermal character. Morphologically, the baryte shows two distinct forms, one prismatic (slatted or lath-like) and the other fibro-radiated (Figure 3-a, Figure 3-b). It reveals various textures: ribboned, brecciated, veined, filled, or stockworked (Figure 3-c). The prismatic baryte concentrated in the heart of the veins is arranged in transparent-to translucent laths (4 to 6 cm in size), which crumble along cleavage planes criss- crossed by tennantite veinlets (3 to 5 mm), showing a ribbon-like (banded) texture (Ba I), (Figure 3-d). Under the microscope, the microcracks in this baryte are seen to be invested with automorphic-to-sub-automorphic quartz crystals and calcite. The milky-white fibro-radiated baryte is often associated with collapse breccias on the spurs of veins in places intersecting the prismatic baryte (Ba II). It contains disseminations of millimetre-sized quartz grains and iron oxides.
3.5. Metallic mineralisation (sulphides and sulphosalts)
Metallic minerals are represented by sulphides and sulphosalts: mineral phase of tennantite series (next only tennantite), chalcopyrite, galena, and sphalerite. Tennantite is often associated with baryte and shows a banded (ribbon-like) texture (Figure 3-e). Its grains appear glomerular and resinous (0.05 mm to 0.5 mm in size) are scattered in the cleavage planes of prismatic baryte or in the long chains in voids and cavities in chalcopyrite and automorphic quartz. Chalcopyrite reveals irregular interstitial shapes scattered throughout the baryte. It is often skeletal, surrounded by a bluish-grey border due to a posterior alteration and sometimes presenting a disseminated texture (Figure 3-f). Galena forms disseminations in microfractures of baryte, ankerite, and iron oxides (Figure 3-g). Sphalerite is much less widespread, occurring as rare millimetre-sized grains scattered in the baryte.
3.6. Carbonates
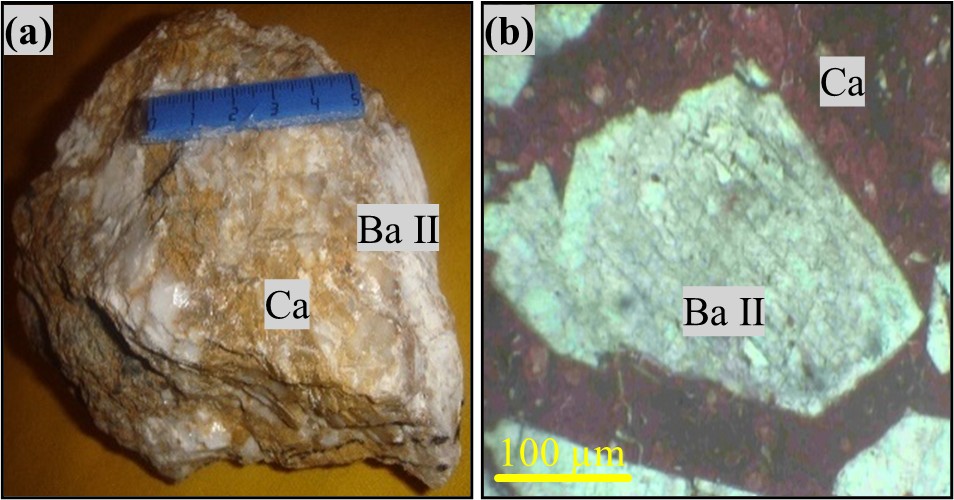
Ankerite is often associated with dolomite, baryte, and quartz. It is post-dolomitisation, presenting a dendritic texture and occupying voids and dissolution pores. Calcite is generally associated with baryte and quartz, occupying voids and pores and showing a rolling extinction with fine multi-coloured edges (Figure 4-a, Figure 4-b). It comes from the post-mineralisation phase.
It is therefore possible to propose an order of succession for the main marker events which contributed to the establishment of the different mineralising phases at the Mizab deposit: (1) A diagenetic phase was responsible for the emplacement of primary dolomites, followed by silicification. (2) A hydrothermal phase was comforted by a series of fractures that set up various mineralisations: barytisation, dolomitisation (Dol II), ankeritisation, barytisation (Ba II), metallic mineralisation, silicification (Qtz II), and calcitisation. (3) Last was a supergene alteration phase, which generated the transformation of sulphur and dioxide minerals.
4. PHYSICO-CHEMICAL ANALYSIS
In this analysis, we carried out a series of granulometric analyses and physico-chemical characterisation experiments on baryte samples.
4.1. Dimensional classification
Granulometric analysis aimed to identify the different grain size ranges in the baryte samples by sorting the constituent mineral species in each fraction. The samples were subjected to mechanical treatment (crushing, homogenisation, and quartering) to reduce them to 20 mm and thus establish a dimensional classification by dry sieving. We used a D407 automatic sieve shaker fitted with a series of sieves with a geometric progression of decreasing mesh sizes: 16, 8, 4, 2, 1, 0.5, 0.25, 0.125, and 0.053 mm. Each sample was sieved for 40 minutes under a magnitude of 60 mm/g, and the rejected mass was weighed with an accuracy of 0.01 g (Wentworth, 1922; Braja, 2019).
4.2. Densimetric analysis
The density of baryte is a property directly linked to the diversity of its uses. It varies according
to the BaSO4 content. We adopt the Lechatelier method with reference to the API 13A standard used by the American Petroleum Institute, in accordance with the amendments adopted in its paragraphs 7 & 20 for the determination of the density of baryte used as an essential additive in drilling fluids (Rouessac F. & Rouessac A., 2007). This analysis was carried out in the quality control laboratory at the ENOF unit in Ain Mimoun (Khenchela).
4.3. X-ray fluorescence spectrometry (XRF)
Qualitative analysis using energy-dispersive X-ray fluorescence spectrometry provided a complete picture of the chemical elements contained in the sample. The principle involves irradiating a sample, either with X-ray beams or by bombardment with particles, so that the ionised atoms emit fluorescence radiation always belonging to the X-ray domain. After grinding, we used the pelletisation technique to obtain the chemical composition of the samples directly from the powder (BRGM, 2005; Beckhoff et al., 2006). The analysis was carried out at the Elegant Materials Research Unit of Ferhat Abbas University Sétif 1 using a Rigaku ZSX Primus dispersion X-ray fluorescence spectrometer (WDXRF).
4.4. X-ray diffraction analysis
X-ray diffraction analysis is a non-destructive, local, selective, and semi-quantitative technique commonly used to characterise crystalline materials and their associated microstructures (Von & Laue, 1926; Bragg, 1934; Barrett, 1957; Hank & Genzel, 1997). When a beam of X-rays of wavelength λ falls on a crystalline material, it is partially scattered by the atoms of the crystal and re-emitted as X-rays of the same wavelength. Bragg's law describes this phenomenon.
The analysis was carried out at the Materials Technology and Process Engineering Laboratory, University of Bejaia using a PANALYTICAL type diffractometer, in four steps : sample grinding - pellet preparation - XRD analysis - analysis of the spectra obtained using HighScore software. The device has an X-ray Tube with a Cu, Mo or Co anode, as required. It operates with a current of 40 mA and a voltage of 45 Kv, according to a wavelength of 1.54 Å (Ångström) for Cu, Kα the most commonly used.
4.5. Infrared spectrophotometry
Infrared spectrophotometry is the absorption class that deals with the infrared zone of the electromagnetic spectrum; it is used to determine the composition of a sample by referring to correlation tables (Tarte, 1962; Alexanian et al., 1966). The principle is based on the absorption of light by the majority of molecules in the infrared zone of the electromagnetic spectrum, which convert this absorption into molecular vibrations expressed as bands (Maglione & Carn, 1975; Farcas & Touzé, 2001; Gennet & Ley, 2004; Dimova et al., 2006; Farcas et al., 2009).
An infrared spectrum is presented as transmittance T (the fraction of transmitted intensity compared to incident intensity) and expressed as a percentage as a function of the wavenumber (inverse of the wavelength) in cm-1. The maximum intensity of an absorption spectrum corresponds to the wavelengths at which absorption is strongest. The maximum intensity of a transmission spectrum is the wavelengths at which absorption is lowest. The sample was prepared using the KBr disc method by mixing 1 mg of the sample with 300 mg of bromide (Carbridge, 1956). The infrared spectra were recorded by a SHIMADZUE FTIR 8400S spectrophotometer at the process engineering laboratory of Abderrahmane Mira University, Bejaia.
5. RESULTS AND DISCUSSION
In this study, we addressed the mineralogical and physico-chemical characterisations of baryte from Ain Mimoun in two essential parts. The first part focused on the mineral analysis and affirmed that this raw material comes from a hydrothermal mineral phase implemented following the geochemical conditions detailed previously (Zedam et al., 2022).
The morphology of the ore bodies shows that baryte is generated in two essential steps: (1) A lamellar, prismatic baryte, crumbly along the cleavage planes and transparent-to-translucent in colour, that represents a first generation of barytisation (Ba I) and occupies the core of the veins. It is preceded by a phase of primary dolomitisation (Dol I) that follows an initial silicification (Qz I). (2) A fibro-radiated, milky-white baryte, often associated with collapse breccias on vein spurs (Ba II), intersects the prismatic baryte, indicating that it post-dates it. It is characterised by disseminations of millimetre-sized quartz grains from the second, much later phase of silicification (Qz II).
The two generations of baryte are interspersed by a second phase of post-primary dolomitisation (Dol II) followed by intense ferrification, which gave rise to the formation of ankerite (Haddouche et al., 2010 ; Zedam et al., 2022).
From a petrological point of view, baryte is closely related to a rich and diverse mineralogical assemblage. It is emplaced between two main phases of dolomitisation, followed consecutively by ferrification, metallic mineralisation, a second silicification, and ultimately calcitisation. The supergene alteration phase further enriches the content of this assemblage with its alteration products (rare cerussite and anglesite, malachite, azurite, late calcite, Iron oxides and hydroxides).
The second part dealt with the physical and chemical characterisation of the raw material. The dimensional classification shows the sieving results of the different particle size ranges recorded in the Table 1. The curve showing the variation in cumulative yields as a function of sieve mesh size reveals an irregular weight distribution across particle size sections (Figure 5). It is proportional to the decrease in mesh diameter, indicating a predominance of the class larger than 8 mm (22.31%), which can be explained by high hardness due to the presence of quartz grains associated with baryte. The highest cumulative reject yields correspond to the lowest ore densities, coinciding with the finest particle size ranges. This means that the lower the baryte content, the more impure the ore becomes and thus the more prone to fragmentation and dissociation (Tourenq, 1994; Ballmann et al., 1998).
|
Table 1. Particle size analysis of Ain Mimoun baryte raw material. |
||
|
Particle size (mm) |
Yield (%) |
Cumulated refusals (%) |
|
+16 |
1.67 |
1.67 |
|
-16 +08 |
22.31 |
23.98 |
|
-08 +04 |
20.21 |
44.19 |
|
-04 +02 |
15.98 |
60.17 |
|
-02 +01 |
11.92 |
72.09 |
|
-01 +0.5 |
7.97 |
80.06 |
|
-0.5 +0.250 |
6.01 |
86.07 |
|
-0.250 +0.125 |
4.98 |
91.05 |
|
-0.125 +0.053 |
5.01 |
96.06 |
|
-0.053 +0 |
3.94 |
100 |
|
TOTAL |
100 |
- |
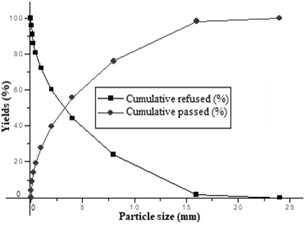
The mesh diameters of the sieves allowing 10%, 30%, 50%, and 60% of the starting material to pass were obtained directly from the cumulative sieve curve. The projection shows that D10 = 0.15 mm, D30 = 1.22 mm, D50 = 3.21 mm, and D60 = 4.74 mm. The calculations of Hazen’s uniformity coefficient (Cu) and classification/curvature (Cc) remain essential for determining the particle size distribution of our substance.
Cu = D60 / D10 = 31.6 (1)
Grain Size Distribution Irregularity Index.
The cumulative sieve curve shows a convex shape, and the Hazen coefficient (Cu) is very high (Cu = 31.6 > 2), which explains the varied grain size. The ore thus has heterogeneous granulometry, justifying the highly variable mechanical strength of the different mineralogical components of the sample (Ayadat & Belouahri, 1996; Gouba, 2023). However, the proportions of quartz in the baryte are variable, directly impacting the quality of the ore for industrial use (e.g., in pharmaceutical products, paints, papers, etc.). The coefficient of curvature (Cc) shows that the grading curve descends regularly, indicating a wide variety of diameters (Batouche et al., 2019). This is a well-graded grain size (i.e., it has well-distributed continuity) due to the heterogeneity of the raw material's mineralogical composition, which reflects the existence of other mineralogical phases associated with baryte (quartz, sulphides, sulphosalts, iron oxides, etc.). The equation:
Cc = (D30)2 / D10 x D60 = 2.09 (2)
describes the shape of the particle size curve between D10 and D60.
The densimetric analysis reveals the BaSO4 content, which perfectly matches the results of the dimensional classification. We note that the coarse-to-medium particle size ranges show the highest density values (indicating purer phases), with a peak of 3.70 (Table 2). On the other hand, the fine slices exhibit lower values (indicating less-pure phases) (Hankel et al., 1992 ; Blavet & Fardoux, 1993).
|
Table 2. Density values according to the Particle size classes for Ain Mimoun baryte raw material. |
||
|
Particle size (mm) |
Yield (%) |
Density values |
|
+16 |
1.67 |
3.50 |
|
-16 +08 |
22.31 |
3.62 |
|
-08 +04 |
20.21 |
3.70 |
|
-04 +02 |
15.98 |
3.67 |
|
-02 +01 |
11.92 |
3.65 |
|
-01 +0.5 |
7.97 |
3.61 |
|
-0.5 +0.250 |
6.01 |
3.55 |
|
-0.250 +0.125 |
4.98 |
3.45 |
|
-0.125 +0.053 |
5.01 |
3.24 |
|
-0.053 +0 |
3.94 |
3.13 |
|
TOTAL |
100 |
- |
X-ray fluorescence spectrometry revealed the main chemical elements in the ore, expressed as oxides, for the different particle size fractions. This analysis clearly shows that the coarse and medium classes are the richest in BaSO4, with levels reaching 54.60%. These slices also show silicification rates (SiO2) that vary between 28.70% and 30.58%. These are the purest baryte phases (Table 3). With the exception of the SrO/BaSO4 ratio, for which the Sr and Ba rates remain proportional due to the geochemical equilibrium of the celestial-barytic solution, the fine classes reveal a significant drop in baryte rates (29.90%) and a net increase in the proportions of other oxides (SiO2, Al2O3, CaO, Fe2O3, K2O, MgO, PbO, etc.) (Goldstein et al., 1992; Jenkins, 1999; Beckhoff et al., 2006). These are the least-pure phases. Notably, the results of this analysis agree with the densimetric and dimensional grading data.
|
Table 3. XRF chemical analysis of Ain Mimoun baryte raw material (in wt. %). |
||||||||||||
|
Particle size (mm) |
MgO |
Al2O3 |
SiO2 |
P2O5 |
K2O |
CaO |
Fe2O3 |
CuO |
ZnO |
SrO |
BaSO4 |
PbO |
|
Global |
0.97 |
7.97 |
32.30 |
0.04 |
1.51 |
3.90 |
2.20 |
0.03 |
-- |
1.06 |
49.82 |
0.20 |
|
+16 |
1.80 |
2.30 |
30.58 |
0.20 |
0.40 |
11.9 |
3.26 |
0.08 |
0.03 |
0.80 |
47.00 |
1.42 |
|
-16 +08 |
0.97 |
4.51 |
30.50 |
0.06 |
0.85 |
6.92 |
2.31 |
0.06 |
0.07 |
1.20 |
52.42 |
0.13 |
|
-08 +04 |
0.66 |
6.78 |
30.15 |
0.04 |
1.47 |
2.82 |
2.09 |
-- |
0.04 |
1.19 |
54.60 |
0.16 |
|
-04 +02 |
0.58 |
7.34 |
30.14 |
0.04 |
1.49 |
2.82 |
2.05 |
-- |
0.04 |
1.18 |
54.00 |
0.15 |
|
-02 +01 |
0.69 |
8.14 |
28.70 |
0.06 |
1.59 |
2.77 |
1.92 |
0.05 |
0.04 |
1.07 |
54.31 |
0.19 |
|
-01 +0.5 |
0.75 |
8.34 |
28.87 |
0.07 |
1.64 |
2.93 |
2.28 |
-- |
-- |
1.03 |
53.50 |
0.23 |
|
-0.5 +0.250 |
0.74 |
7.80 |
29.53 |
0.07 |
1.53 |
3.60 |
2.79 |
-- |
0.03 |
0.98 |
52.30 |
0.36 |
|
-0.250 +0.125 |
0.99 |
11.8 |
36.00 |
0.08 |
2.41 |
3.71 |
3.27 |
0.08 |
0.04 |
0.71 |
40.63 |
0.28 |
|
-0.125 +0.053 |
0.95 |
12.10 |
43.20 |
0.11 |
2.58 |
4.09 |
3.02 |
0.05 |
0.04 |
0.60 |
32.76 |
0.30 |
|
-0.053 +0 |
1.00 |
13.40 |
44.00 |
0.10 |
2.87 |
4.03 |
3.50 |
0.07 |
0.04 |
0.59 |
29.90 |
0.32 |
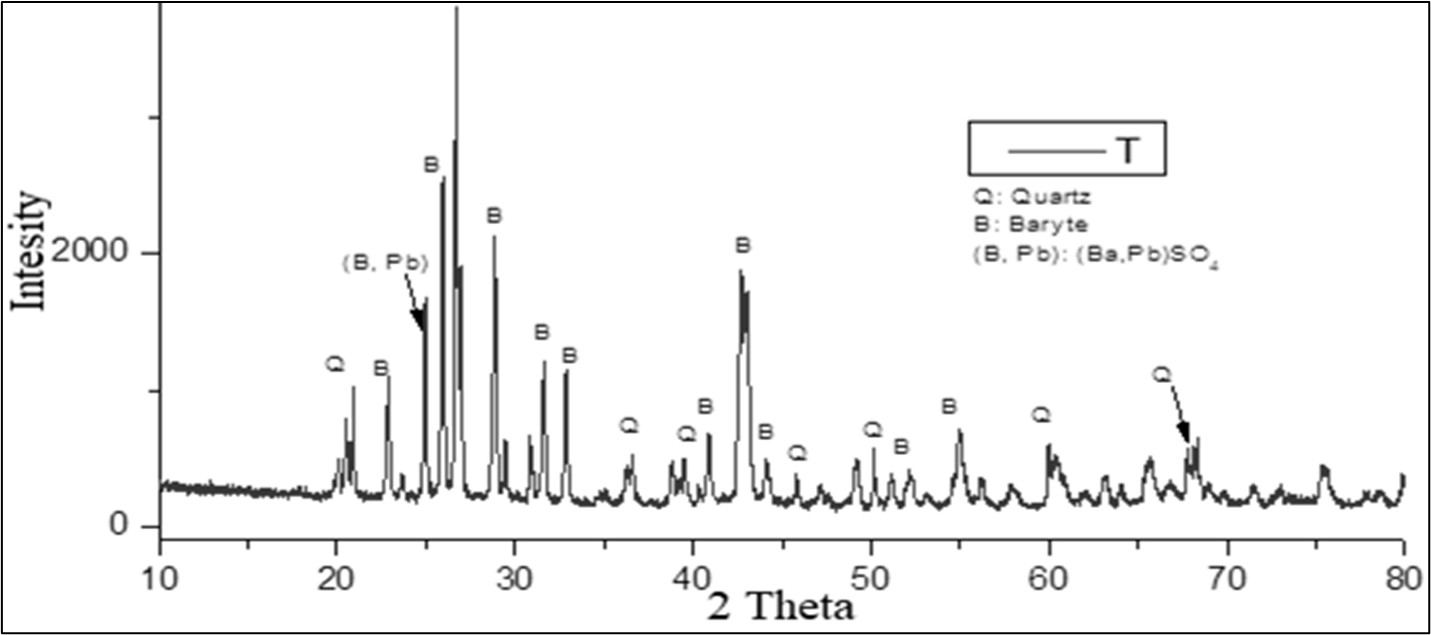
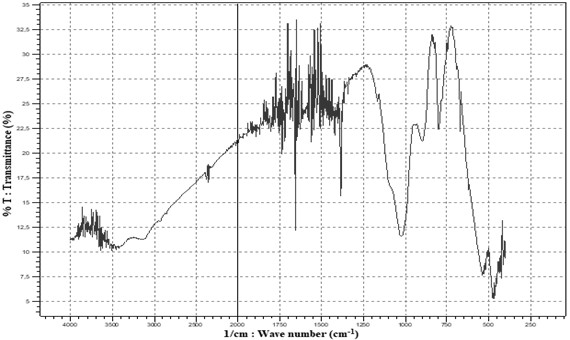
The X-ray diffractograms clearly show the predominance of baryte in the presence of a few other gangue minerals (quartz, calcite, dolomite, etc.; Figure 6). These results further support those of the mineralogical and chemical analyses. Infrared spectrophotometry highlights the frequencies of the characteristic absorption bands corresponding to the normal vibrations of the different radicals composing this ore. It shows several main bands confirming the correlation of the different components of the baryte substance (Table 4). There are four fundamental vibrational modes for the sulphate group. The characteristic frequency vibrations occur at 1180, 1130, 1090, and 990 cm-1 (Figure 7).
|
Table 4. Positions and identification of bands observed on the IR spectrum of Ain Mimoun baryte raw material. |
|
|
Position (cm-1) and intensity of bands |
Band identification |
|
3400 cm-1 |
Hydration band OH – (H2O) |
|
3100 cm-1 |
Crystallisation band OH – (H2O) |
|
2030 cm-1 |
Vibration band Ba – S – O |
|
1025 cm-1 |
Vibration band Si – O |
|
880 cm-1 |
Construction band CO42- |
|
850 cm-1 |
Link band Fe – O |
|
640 cm-1 |
Vibration and construction band Ba – S – O12 |
|
490 cm-1 |
Bond deformation Fe – O |
|
440 cm-1 |
Bond deformation Fe – O |
The peak at 2030 cm-1 is attributed to the stretching and bending vibrations of the Ba-S-O bond (Mayer et al., 2006). The peak at 1180 cm-1 is characteristic of the asymmetric stretching vibration of the sulphate group, while that at 1130 cm-1 is attributed to the S-O triple-stretching mode commonly found in baryte groups (Janaki & Velraj, 2011). The peak at 1090 cm-1 is assigned to the symmetric stretching of the SO4 group, while that at 990 cm-1 specifies the symmetric stretching of tetrahedral SO4.
The vibrational frequencies in the range 1197–1076 cm-1 are related to baryte (Mukamel, 2000; Hollas, 2003; Demirdöven et al., 2004). The peak at 990 cm-1 can be attributed to particle size variations of the clay and the interaction of tetrahedral SO4 and metal oxides (Al-O, Si-O, etc.) present as impurities in the clay (Ramaswamy et al., 2010). The peak at 880 cm-1 can be attributed to the symmetric stretching modes of the CO3 present in the calcite, suggesting that the presence of calcite in the baryte ore is an impurity, which agrees closely with the 874 cm-1 peak (Mayer et al., 2006).
The aforementioned authors attribute the 644 - and 630 cm-1 peaks to the octahedral stretching vibration of BaO12 in the spectra of exogenous and endogenous baryte samples, which corresponds closely to the 640 cm-1 peak in our case study.
6. CONCLUSION
The Ain Mimoun baryte deposit is a vein complex confined within the E-W, NE-SW and NW-SE fractures and faults on the northern flank of the Khenchela anticline, the last link of the Aurès mountain chain to the east. This anticline is a structural entity inherited from the major Atlassic compressional phase, late Lutetian to Bartonian, consisting of mega-blocks. The geological formations are arranged in concordant series, with detrital facies from the lower Cretaceous gradually replaced by carbonate lithologies from the upper Cretaceous.
The petro-mineralogical analysis shows that the baryte is generated by a hydrothermal mineralising fluid, in two distinct phases: (a) A lamellar baryte (Ba I), succeeding the primary dolomite (Dol I) having undergone an initial silicification (Qz I). (b) A fibro-radiated baryte (Ba II), with quartz grains resulting from a second silicification (Qz II). The two generations of baryte (Ba I + Ba II), related to a rich mineralogical assemblage; are interspersed by a second dolomitisation phase (Dol II).
The analytical techniques applied in this study (particle size analysis, densimetric separation, XRD, XRF, and IR) show the close relationship between the succession of mineralogical phases on the one hand and the granulometric distribution, as well as the evolution of the chemical contents, on the other hand. The sizes of the mineral grains and their arrangement highlight the liberation mesh from which we recommend the most appropriate enrichment method for the ore, namely flotation. Optimal recovery was achieved using oleic acid as a collector, sodium sulphate and sodium silicate as depressants and pine oil as a frother, within an alkaline medium at pH 10.
Barite demonstrates a broad spectrum of industrial applications : chemical and pharmaceutical sectors, medicine, mineral fillers, oil and gas drilling fluids, civil engineering, and construction.. Its economic value is primarily driven by its favorable physico-chemical properties: high specific gravity, whiteness, and effective radiation absorption. The commercial use of barite is governed by stringent standards and technical specifications, typically dictated by end-user requirements. Adherence to AFNOR standards and consultation of producers technical data sheets are imperative. Globally, approximately 80% of baryte production is consumed in oil and gas exploration, where it comprises up to 40% of drilling mud formulations, under regulations defined by the American Petroleum Institute (API).
For use in friction materials as an inert filler, baryte must contain 10 – 40 % BaSO₄, exhibit a density between 3.8 and 4.0, and have a particle size near 40 µm. Conversely, applications in the chemical industry demand significantly higher purity standards (BaSO₄ > 95%, SrSO₄ < 2%, SiO₂ < 2%, Fe₂O₃ < 0.4%, CaF₂ < 100 ppm, Hg and Cd < 0.04 ppm).Despite elevated concentrations of silica (32.30%), alumina (7.97%), and calcite (3.90%), the physico-chemical attributes of the Ain Mimoun baryte are deemed suitable for use in drilling fluids and as an inert filler. However, its use in high-purity chemical applications remains dependent on an effective enrichment process.
It would be more fruitful to attempt the application of alternative beneficiation techniques, enabling the production of a high-quality concentrate wich aligns with both the geochemical constraints of the ore and prevailing market requirements, in line with an economically viable and environmentally responsible development approach.
Acknowledgements
At the end of this work, we would like to present our gratitude and appreciation as well as our sincere thanks to all local officials of the wilaya of Khenchela, especially the director of the barite unit (ENOF) at Ain Mimoun, for all the efforts and assistance deployed in our favor.
Our thanks also go to the professors in charge of the research units and laboratories : LGM Biskra, EMRU Sétif, LGP Bejaia and GEOL Annaba, for their advanced facilities in terms of physico- chemical analyses.
Finally, we must not forget the colleagues who helped us with their valuable guidance, so that this humble characterization work could be carried out.
REFERENCES
- Abdellaoui, K., Boumaza, A., Kamoun, N., & Boutaleb, A., 2019. Chemical And Physical Investigations On The Barite Of Ain Mimoun Ore Deposit – khenchela – North - eastern Algeria. Journal of Advanced Research in Science and Technology. 2019, 6 (1), 865-877. https://asjp.cerist.dz/en/article/80400.
- Alexanian, C., Morel, P., & Le Bouffant, L., 1966. Sur les spectres d’absorption infrarouge des minéraux naturels. Bull. Soc. Fr. Cérmn., 71: 3-38.
- Ayadat, T., & Belouahri, B., 1996. Influence du coefficient d'uniformité sur l'amplitude et le taux de l'affaissement des sols. Revue Française de Géotechnique, N° 76, 3e trimestre, 1996, 10 pages. https://www.geotechniquejournal.org / articles / geotech / pdf 1996/03/geotech1996076p25.pdf.
- Ballmann, P., Collins, R., Delalande, G., Van Den Elshout, J., Mishellany, A., & Sym, R., 1998. Determination of the mechanical strength of aggregates. Synthesis report, MAT 1, CT 93, 0040.
- Batouche, T., Bouzenzana, A., Zedam, R., & Bourourou M., 2019. Mineralogical and physico-chemical characterization of barite wastes from Ain Mimoun deposit (Khenchela, Algeria). Solid State Physics, Mineral Processing. ISSN 2071-2227, Naukovyi Visnyk NHU, 2019, № 3. https://DOI:10.29202/nvngu/2019-3/5.
- Batouche, T., 2021. Caractérisation et traitement du minerai barytique d’Aïn Mimoun pour l'obtention d'un concentre de haute qualité. Thèse de Doctorat LMD, Université de Tébessa. 2021, 136 p. https://fr.scribd.com/document/729931662/tratem nt-barytine.
- Barrett, C.S., 1957. Structure des métaux. DUNOD, Paris (1957), pp.397.
- Beckhoff, B., Kanngießer, B., Langhoff, N., Wedell, R., Wolff, H., 2006. Handbook of Practical X-Ray Fluorescence Analysis. (385 Figures and 53 Tables). Springer-Verlag, Berlin. Heidelberg 2006. 833p. https://link.springer.com/book/10.1007/978-3-540-36722-2.
- Bellion, Y., Donze, P., & Guiraud, R., 1973. Répartition stratigraphique des principaux Ostracodes (Cytheracea) dans le Crétacé supérieur du sud ouest constantinois. (Confins Hodna - Aurès, Algérie du nord). Bull. Serv. Géol. Algérie, N° 4, pp 1-136.
- Benabbas, C., 2006. Evolution Mio-Plio-Quaternaire des bassins continentaux de l’Algérie nord orientale : Apport de la photogéologie et analyse morpho structural. Thèse de Doctorat d’état, Univ. Mentouri, Constantine, Algérie, 256 p. http://depot.umc.edu.dz/handle/123456789/7405.
- Blavet, D., & Fardoux, J., 1993. Méthode densimétrique simplifiée pour l'estimation sur mottes de terre de la porosité totale et de caractéristiques associées (masse volumique apparente, masse volumique pseudo réelle sèche): protocole: évaluation des biais et des incertitudes. Montpellier: Orstom, 35 p. Multigr. https://www.documentation.ird.fr/hor/fdi:010018796.
- Bragg, W. L., 1934. Macmillan. New York (1934), (1), pp.18.
- Braja, M. Das., 2019. Advanced soil mechanics. Fifth Edition, 15 April 2019, London. Imprint CRC Press, Pages 734. https://doi.org /10.1201/ 9781351215183.
- BRGM/RP- 53377 – Fr., 2005. Evaluation des performances du spectromètre portable de fluorescence X Niton XL723S. BRGM/RP. 53377. FR. Avril 2005. 107 p. https://infoterre.brgm.fr/rapports/RP-53377-Fr.pdf.
- Bureau, D., 1986. Approche sédimentaire de la dynamique structurale : évolution mésozoïque et devenir orogénique de la partie septentrionale du fossé saharien. Thèse d'état, UPMC, Paris VI, 441 p. 2T.
- Carbridge, D.E., 1956. Journal Applied Chemistry. 6, 456.
- Camoin, G., Bouju, J. P., Maurin, A. F., Perthuisot, V., & Rouchy, J. M., 1990. Relation récifs-diapirs : l’exemple du Sénonien de la région de Khenchela. (Algérie centre - orientale). Bull. Soc. Géol. France, (8), t VI, N° 5, pp. 831- 841.
- Demirdöven, N., Cheatum, C. M., Chung, H. S., Khalil M., Knoester, J., & Tokmakoff, A., 2004. Two dimensional infrared spectroscopy of antiparallel bêta-sheet secondary structure. Journal of the American Chemical Society. 2004 Jun 30 ; 126(25) : 7981-90. https://Doi : 10.1021/ja049811j.
- Deniz, V., & Güler, T., 2018. Production of white barite from barite concentrates of shaking tables by bleaching process after magnetic methods. January 2018 Inżynieria Mineralna 19 (1) :77-82. https://dx.doi.org/10.29227/IM-2018-01-12
- Dhahri, F., & Boukadi, N., 2010. The evolution of pre existing structures during the tectonic inversion process of the Atlas chain of Tunisia. Journal of African Earth Sciences. Volume 56, Issues 4–5, March 2010, Pages 139-149. https://doi.org/10.1016/j.jafrearsci.2009.07.002.
- Dimova, M., Panczer G., & Gaft, M., 2006. Spectroscopic study of barite from the Kremikovtsi Deposit (Bulgaria) with implication for its origin. Geoloski anali Balkanskoga poluostrva January 2006 Issue 67, Pages : 101-108. https://doi.org/10.2298/GABP0667101D.
- Doglioni, C., Gueguen, E., Harabaglia, P., & Mongelli, F., 1999. On the origin of W-directed subduction zones and applications to the western Mediterranean. October 1999, Geological Society, London Special Publications 156 (1) :541-561. https://doi.org/10.1144/GSL.SP.1999.156.01.24.
- Farcas, F., & Touzé P., 2001. La spectrométrie infrarouge à transformée de Fourrier (IRTF): Une méthode intéressante pour la caractérisation des ciments. Bulletin des laboratoires des ponts et chaussées No 230, Janvier – Février 2001, REF. 4350. PP. 77 -88. https://www.ifsttar.fr/collections/BLPCpdfs/blpc_230_77-88.pdf
- Farcas, F., Mouillet, V., Besson, S., Battaglia, V., Petiteau, C., & Le Cunff, F., 2009. Identification et dosage par spectrométrie infrarouge à transformée de Fourrier des copolymères SBS et EVA dans les liants bitumineux. Méthode d’essai No 71. Octobre 2009. Laboratoire central des ponts et chaussées, Octobre. LCPC. Paris Cedex 15. 20 p. https://www.ifsttar.fr/fileadmin/user_upload/editions/lcpc/MethodeDEssai/MethodeDEssai-LCPC ME71.pdf
- Friedman, G.M., 1965. Terminology of Crystallization Textures and Fabrics in Sedimentary Rocks. Journal of Sedimentary Research, 1965 (35), 643-655. https://doi.org/10.1306/74d7131b-2b21-11d7 8648000102c1865d
- Frizon de Lamotte, D., Michard, A., & Saddiqi, O., 2006. Quelques développements récents sur la géodynamique du Maghreb. Comptes Rendus. Géoscience, Volume 338 (2006) no. 1-2, pp. 1-10. https:// DOI : 10.1016/j.crte.2005.11.006.
- Gennet, D., & Ley, C., 2004. Introduction à la spectroscopie Infrarouge (I.R.). Culture Sciences Chimie. Adamchemik, Wikimedia. 38 p. https://culturesciences.chimie.ens.fr/thematiques/ himie-analytique/spectroscopies/introduction-a-la spectroscopie-infrarouge-ir.
- Goldstein, J., Newbury, D.E., Joy, D.C., Lyman, C.E., Echlin, P., Lifshin E. Sawyer, L., & Michael, J.R., 1992. Scanning Electron Microscopy and X-Ray Microanalysis: A text for biologists, materials scientists, and geologists. New York / London, Plenum Press, 1992, 820 p.
- Gouba, B., 2023. Traçage de la courbe granulométrique et la détermination des coefficients de Hazen par la méthode analytique. Revue Internationale de la Recherche Scientifique, ISSN : 2958-8413 Vol. 1, No. 1, Février 2023. 11 pages. https://doi.org/10.5281/zenodo.7647398.
- Gregg, J.M., & Sibley, D.F., 1984. : Epigenetic Dolomitization and the Origin of Xenotopic Dolomite Texture. January 1984. Journal Of Sedimentary Research. 54 (3) : 908-931. https://DOI:10.1306/212F8535-2B24-11D7864800
- Guiraud, R., 1990. Evolution post-triasique de l’avant pays de la chaîne alpine en Algérie d’après l’étude du Bassin du Hodna et des régions voisines. Pub. Office National de la Géologie, Mémoires N°3, pp. 1-259. https://searchworks.stanford.edu/view/2016746.
- Haddouche, O., Hebert, R., & Boutaleb, A., 2010. Géologie, gîtologie et microthermométrie des minéralisations à Ba-Pb, (Zn, Cu), liées au segment NE du Djebel Azerag – Djebel Khenchela (Monts des Aurès) : Exemples des gisements d'Ichmoul et d'Ain Mimoun. Bulletin du Service Géologique de l'Algérie. Vol. 21, n°2, pp.165-182,10 fig., 1 tabl. https://asjp.cerist.dz/en/article/3046.
- Hank, V., & Genzel, Ch., 1997. Structural and Residual Stress Analysis by Non destructive methods. Elsevier (1997), pp.435.
- Hankel, D., Rosenstock, F., & Biehler, G., 1992. The effect of attrition in the Lurgi - Deconterra process for decontamination of soil. Aufbereitungs Technik -33, n°5, pp. 257-265.
- Herkat, M., 1992. Manifestations diapiriques du Trias dans les séries du Crétacé supérieur de l’Atlas Saharien et des Aurès. Bull. Serv. Géol. Algérie, vol. 3, N°1, 199, pp.15-27.
- Hezzi, I., 2014. Caractérisation géophysique de la plateforme de Sahel, Tunisie nord orientale et ses conséquences géodynamiques. Thèse de Doctorat Univ. Rennes 1. Préparée à l’unité de recherche CNRS URM 6118 Géosciences Rennes (OSUR). 2014, 316 p. https://theses.hal.science/file/index/docid/995595/ ilename/These_ImedHezzi-.2014.pdf
- Hollas, J. M., 2003. Spectroscopie. Dunod. EAN 978210 0070718. Paris, Jun 2003.
- Jallouli, C., Chikhaoui, M., Braham, A., Turki, M. M., Mickus, K., & Benassi, R., 2005. Evidence for Triassic salt domes in the Tunisian Atlas from gravity and geological data. Elsevier. Tectonophysics 396 (2005) 209 – 225. https://doi:10.1016/j.tecto.2004.12.003.
- Janaki, K., & Velraj, G., 2011. Spectroscopic studies of some fired clay artificats recently excavated at Tittagudi in Tamilnadu. Recent Research in Science and Technology 2011, 3 (3): 89-91.
- Jébrak, M., 1992. Les textures intra-filoniennes, marqueurs des conditions hydrauliques et tectoniques. Chronique de la recherche minière, N° 506, 1992, pp. 25 – 35, 6 fig.
- Jenkins, R., 1999. Fluorescence spectrometry. 2nd ed. New York, Wiley - Interscience, 1999.
- Kazi-Tani, N., 1986. Evolution géodynamique de la bordure Nord-Africaine : le domaine intraplaque Nord-Algérien. Approche méga-séquentielle. Thèse de Doctorat ès Sciences, Univ. Pau et des Pays de l’Adour, 871p. 2 Tomes, Addentium. https://theses.fr/1986PAUU3010.
- Khomsi, S., Bédir, M., Soussi, M., Ghazi Ben Jemia, M., & Ben Ismail Lattrache, K., 2006. Mise en évidence en subsurface d’événements compressifs Eocène moyen – supérieur en Tunisie orientale (Sahel) : Généralité de la phase Atlasique en Afrique du Nord. Comptes rendus des Géosciences. Paris, t 338, pp. 41-49. https://doi.org/10.1016/j.crte.2005.11.001.
- Laffitte, R., 1939. Etude géologique des Aurès. Bull. Serv. Carte géol. Algérie, 484 p, 2ème série, N° 15, Alger. pp. 175-451.
- Lessard, L., 1955. Faciès béchiques dans le Crétacé supérieur et âge des premières manifestations diapiriques du Trias près de Khenchela. Publ. Serv. Carte géol. Algérie. N° 5, Alger., pp. 379-390.
- Maglione, G., & Carn, M., 1975. Spectres infrarouges des minéraux salins dans le bassin Tchadien. Cah. Orstom, Série Géol., Vol. Vii, No 1, 1975: 3-9.
- Mayer, D., Gerard, P., & Michel, G., 2006. Spectroscopic studies of barite from the kremikovtsi deposit (Bulgaria) with implication for its origin. Annales géologiques de la Péninsule Balkanique (67) 101 108.
- M’Rabet, A., 1981. Stratigraphy, Sedimentation and Carbonate Diagenesis of the Lower Cretaceous Series of Central Tunisia. Doctor Thesis, University of Paris-Sud, Faculty of sciences (Essonne). Orsay, 1981, 540 p.
- Mukamel, S., 2000. Multidimensional Fentosecond Correlation Spectroscopies of Electronic and Vibrational Excitations. February 2000. Annual Review of Physics and Chemistry. Vol. 51, 2000, (1): 691-729. https://DOI 10.1146 / annu rev.physchem.51.1.691.
- Perthuisot, V., Rouvier, & H., Smati, A., 1988. Style et importance des déformations anté-vraconiennes dans le Maghreb Oriental : exemple du diapir du Jebel Slata (Tunisie centrale). Bull. Soc. Géol. Fr., (6), IV, 3, pp. 391-398.
- Perthuisot, V., 1994. Structures et géométrie des diapirs maghrébins. Essai de synthèse. Mémoires du Service Géologique de l'Algérie. N°6, pp.153-159, 5 fig.
- Piqué, A., Tricart, P., Guiraud, R., Laville, E., Bouaziz, S., Amrhar, M. & Ait Ouali, R., 2002. The Mesozoic – Cenozoic Atlas belt (North Africa) : an overview. Geodinamica Acta 15 (2002) 185-208. https://doi.org/10.1016/S0985-3111(02)01088-4.
- Popov, A., 1968. Les types morphologiques et la répartition des gisements de zinc et de plomb en Algérie. Ann. Mines et Géol. Tunis, 23, 103-203.
- Ramaswamy, V., Vimalathithan, M. R., & Ponnusamy, V., 2010. Synthesis of well dispresed, elliptical shaped Barium sulphate nano particles water chloroform mixed solvent. Archives of Physics Research, 2010, 1 (4) : 217-226.
- Rouessac, F., & Rouessac, A., 2007. Chemical analysis modern instrumentation methods and techniques. Second Edition. Translated by Francis and Annick Rouessac and Steve Brooks. Includes bibliographical references and index. ISBN 978-0 470-85902-5. 566 p.
- Tarte, P., 1962. Etude des silicates par spectrométrie infrarouge. Bull. Soc. Fr. Céram., D. 553 : 13-34. Cah. Orstom.
- Tourenq, C., 1994. La normalisation dans le domaine des granulats. Revue générale des routes et aérodromes, 720 p, juin 1994.
- U. S. Geological Survey, 2019. Mineral Commodity Summaries 2019 : U.S. Geological Survey, 200 p. https://doi.org/10.3133/70202434.
- Vergés, J., & Sàbat, F., 1999. Constraints on the Neogene Mediterranean kinematic evolution along a 1000 km transect from Iberia to Africa. October 1999. Geological Society London Special Publications 156(1):63-80. https://doi.org/10.1144/GSL.SP.1999.156.01.05
- Vila, J.M., 1977. Carte géologique de l’Algérie au 1/50.000, feuille de Khenchela N° (203), avec notice explicative détaillée (levés de Guellal S. Et Megartsi M.). Serv. Carte géol. Algérie/ Sonatrach. https://www.sudoc.fr/049451766.
- Vila, J. M., 1980. La chaîne alpine d’Algérie orientale et des confins algéro-tunisiens. Thèse de Doctorat d'Etat, Université Pierre et Marie Curie, Paris VI, France, 3 vol., 665 p., 199 fig., 40 pl., 7 pl. h. t. https://search.worldcat.org/fr/title/oclc/490785854.
- Von, M., & Laue, Z., 1926. Kristallogr. Numéro édit. (6), 115 pages.
- Wentworth, C. K., 1922. A scale of grade and class terms for clastic sediments. The Journal of Geology, Vol. 30, No. 5 (Jul. - Aug., 1922), pp. 377-392. https://doi.org/10.1086/622910.
- Yahiaoui, A., 1990. La partie inférieure de la série marno calcaire du Crétacé supérieur (Cénomanien supérieur à Coniacien inférieur entre Batna et El Kantara). Algérie orientale: Stratigraphie, Sédimentologie et Paléogéographie. Thèse de Doctorat. Université Nancy I, 207 p. https://theses.fr/1990NAN10047
- Ysbaa, S., Haddouche, O., Boutaleb, A., Sami, L., & Kolli, O., 2021. Mineralization and fuid inclusion characteristics of Pb-Zn-Fe-Ba (Cu, F, Sr) ore deposits in northern east of Algeria. June 2021. Arabian Journal of Geosciences 14 (11). https:// DOI : 10.1007/s12517-021-07281-2.
- Zedam, R., 1998. Etude gîtologique du gisement de Barytine (Mizab). Ain Mimoun, Khenchela. Thèse de Magister, Université d’Annaba, Algérie, 132 p. https://www.ccdz.cerist.dz/admin/notice.php?id=0515201000000.
- Zedam, R., Laouar, R., & Bouhlel, S., 2007. Analyse Pétrographique et Sedimentologique de l’Albien d’Ain Mimoun, Khenchela, (Nord-Est Algérie). Revue Sciences & Technologie D, Univ. Mentouri, Constantine, Algérie. N° 26, pp. 09-19. https:// revue.umc.edu.dz/d/article/ view/516/623.
- Zedam, R., 2012. Mise en place d'une Minéralisation Hydrothermale au flanc Nord de l'Anticlinal de Khenchela. Identification et détermination sur fond Lithostratigraphique et Tectonique. Thèse de Doctorat es Sciences. FSTGAT, Zouaghi Slimane. Uni. Mentouri, Constantine, Algérie, 220 p. https://fac.umc.edu.dz/fst/fichiers/GEOLOGIE.pdf
- Zedam, R., Laouar, R., Lekoui, A., Metrouni, H., Bouhlel, S., Boyce, A. J., & Fallick, A. E., 2022. Origin of the Mizab barite vein-type deposit, Ain Mimoun (NE Algeria): Evidence from fluid inclusion and stable S-, O- and C-isotope studies. Arabian Journal of Geosciences. AJGS, Article 298, Volume 15, issue 3, February 2022. https://link.springer.com/article/10.1007/s12517 022-09611-4.